Eino Dev Visual Debugging Plugin Guide
Introduction
💡 Use this plugin to visually debug orchestration artifacts (Graph, Chain) built with the Eino framework, including:
- Visual rendering of orchestration artifacts;
- Debugging from any operable node with mock input.
Quick Start
Download eino-examples
GitHub repository: https://github.com/cloudwego/eino-examples
# HTTPS
git clone https://github.com/cloudwego/eino-examples.git

# SSH
git clone git@github.com:cloudwego/eino-examples.git
Install Dependencies
Run the following commands in order in the project directory:
# 1. Pull latest devops repository
go get github.com/cloudwego/eino-ext/devops@latest

# 2. Cleans and updates go.mod and go.sum
go mod tidy
Run the Demo
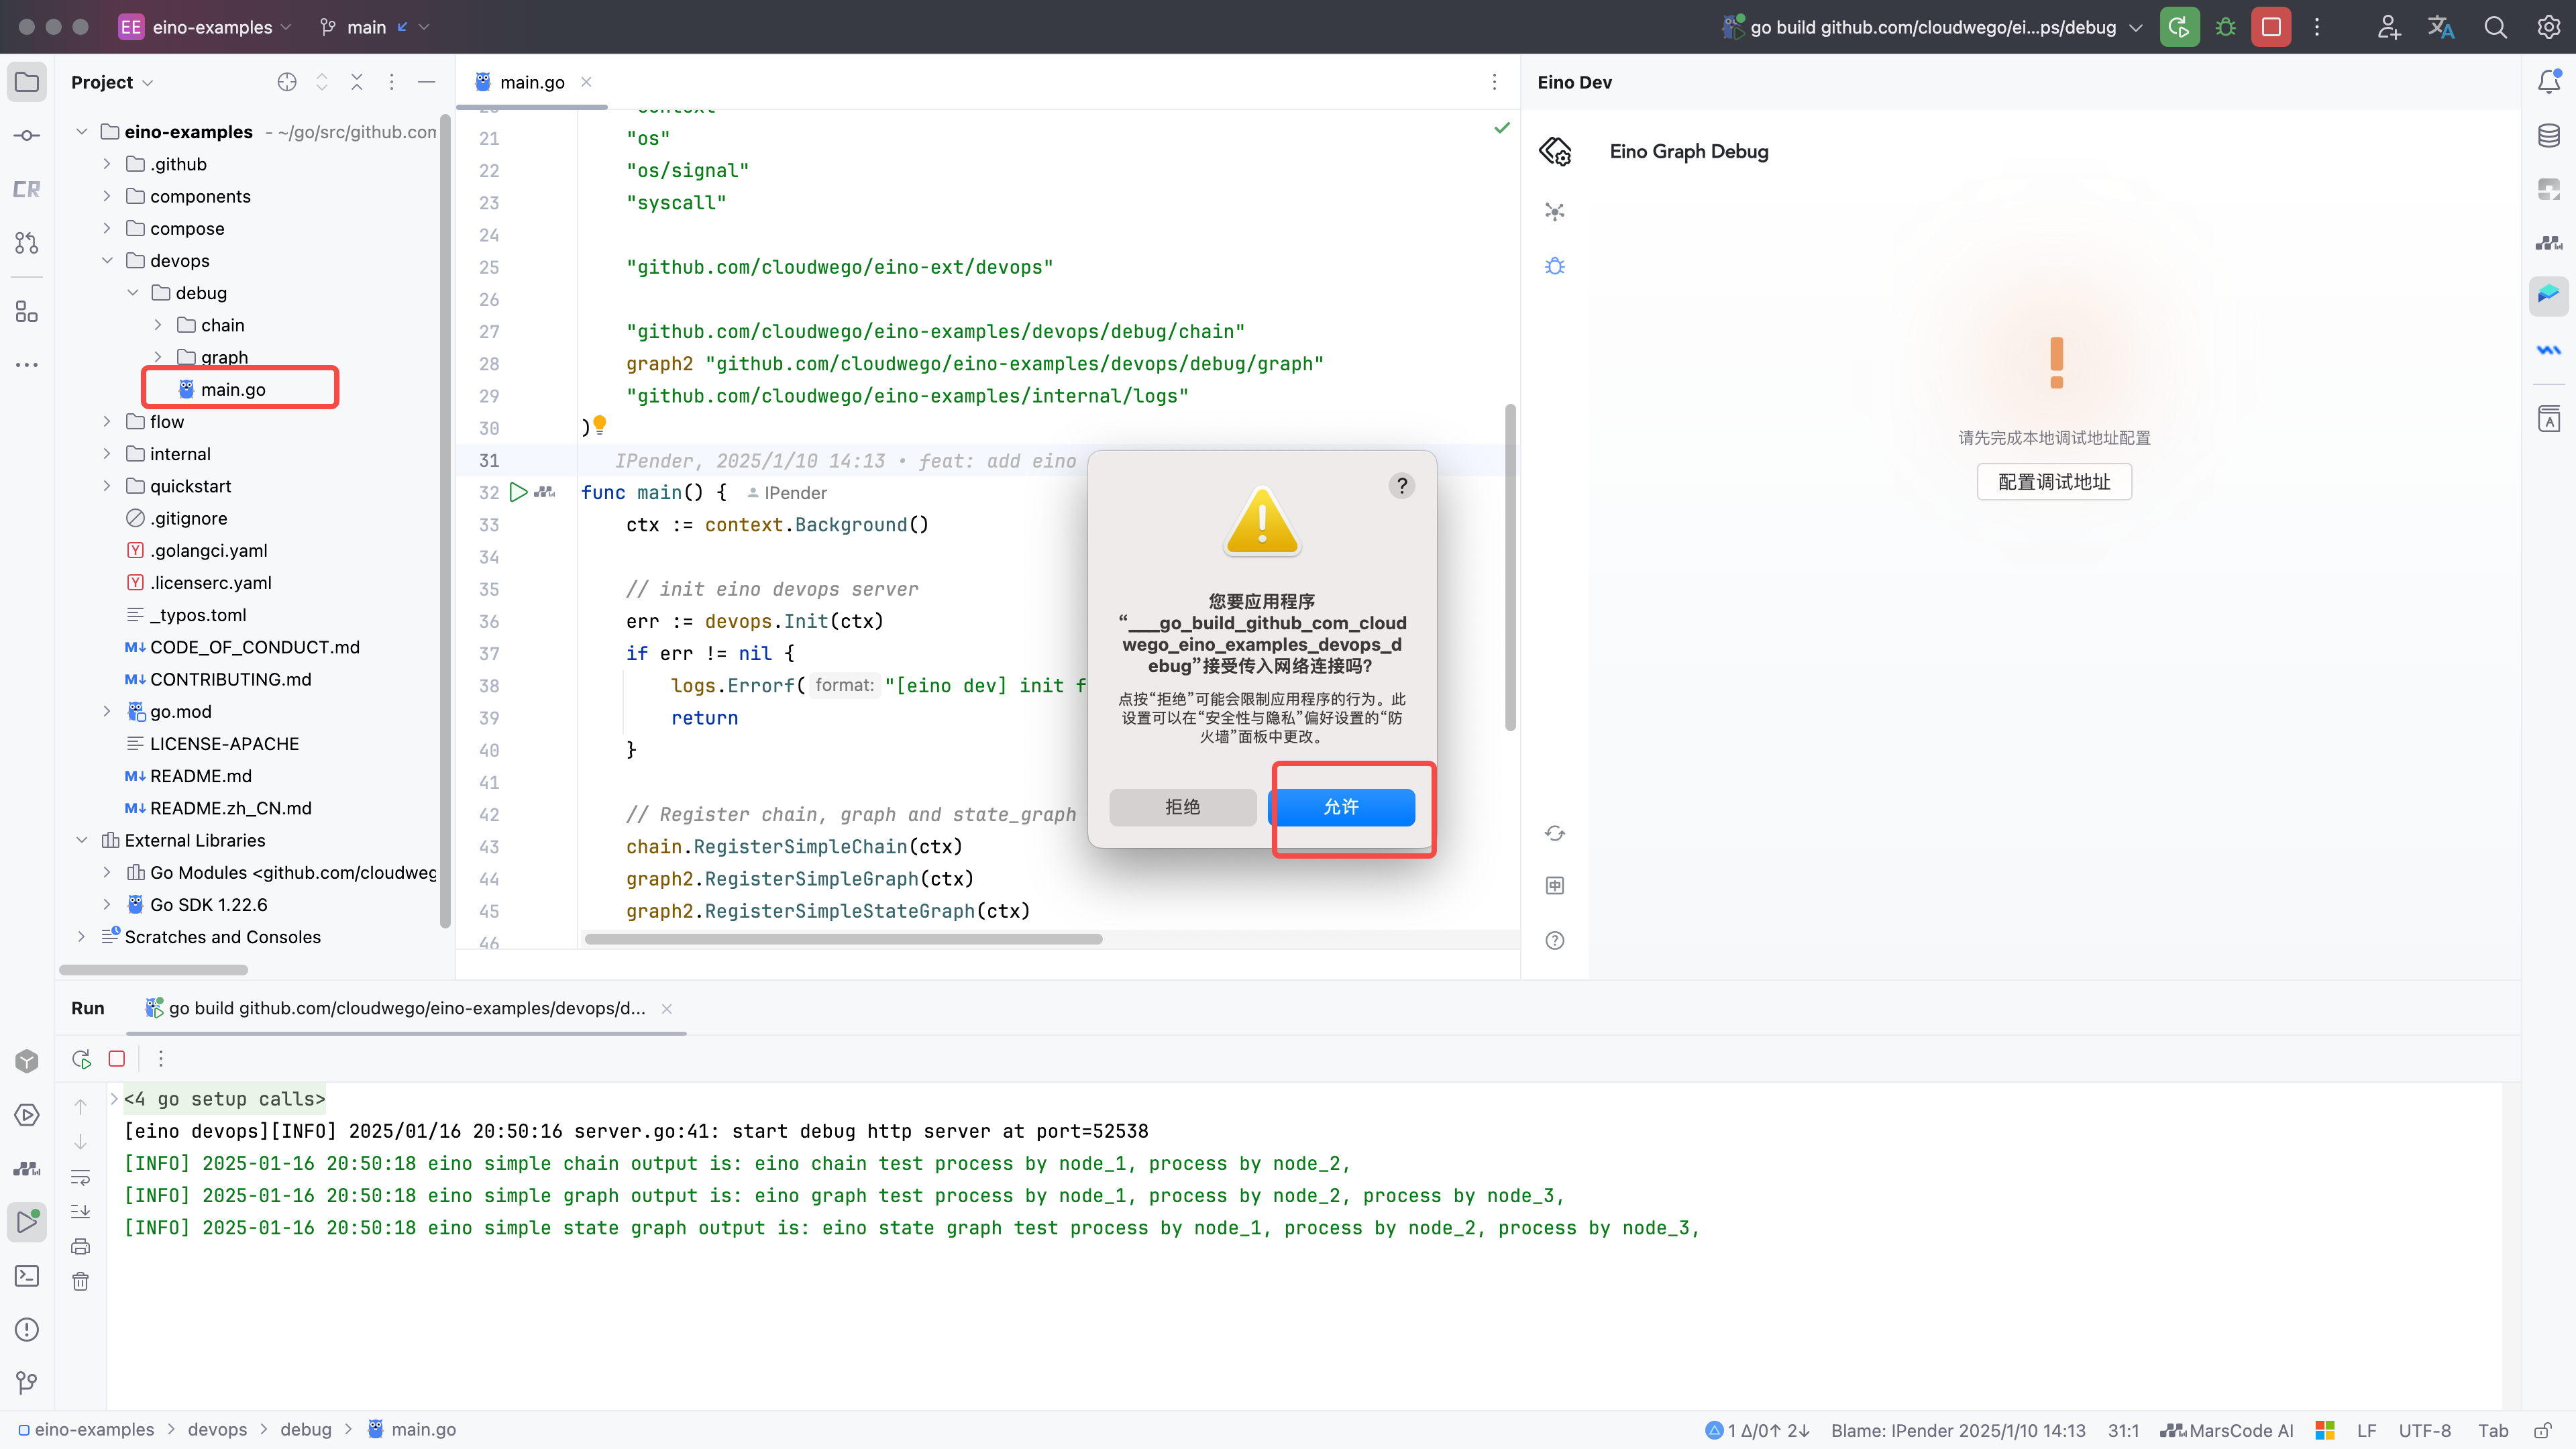
Navigate to eino-examples/devops/debug/main.go and run main.go. Since the plugin also starts a local HTTP service to connect to the user’s service process, a network access warning will pop up — click Allow.
Configure the Debug Address
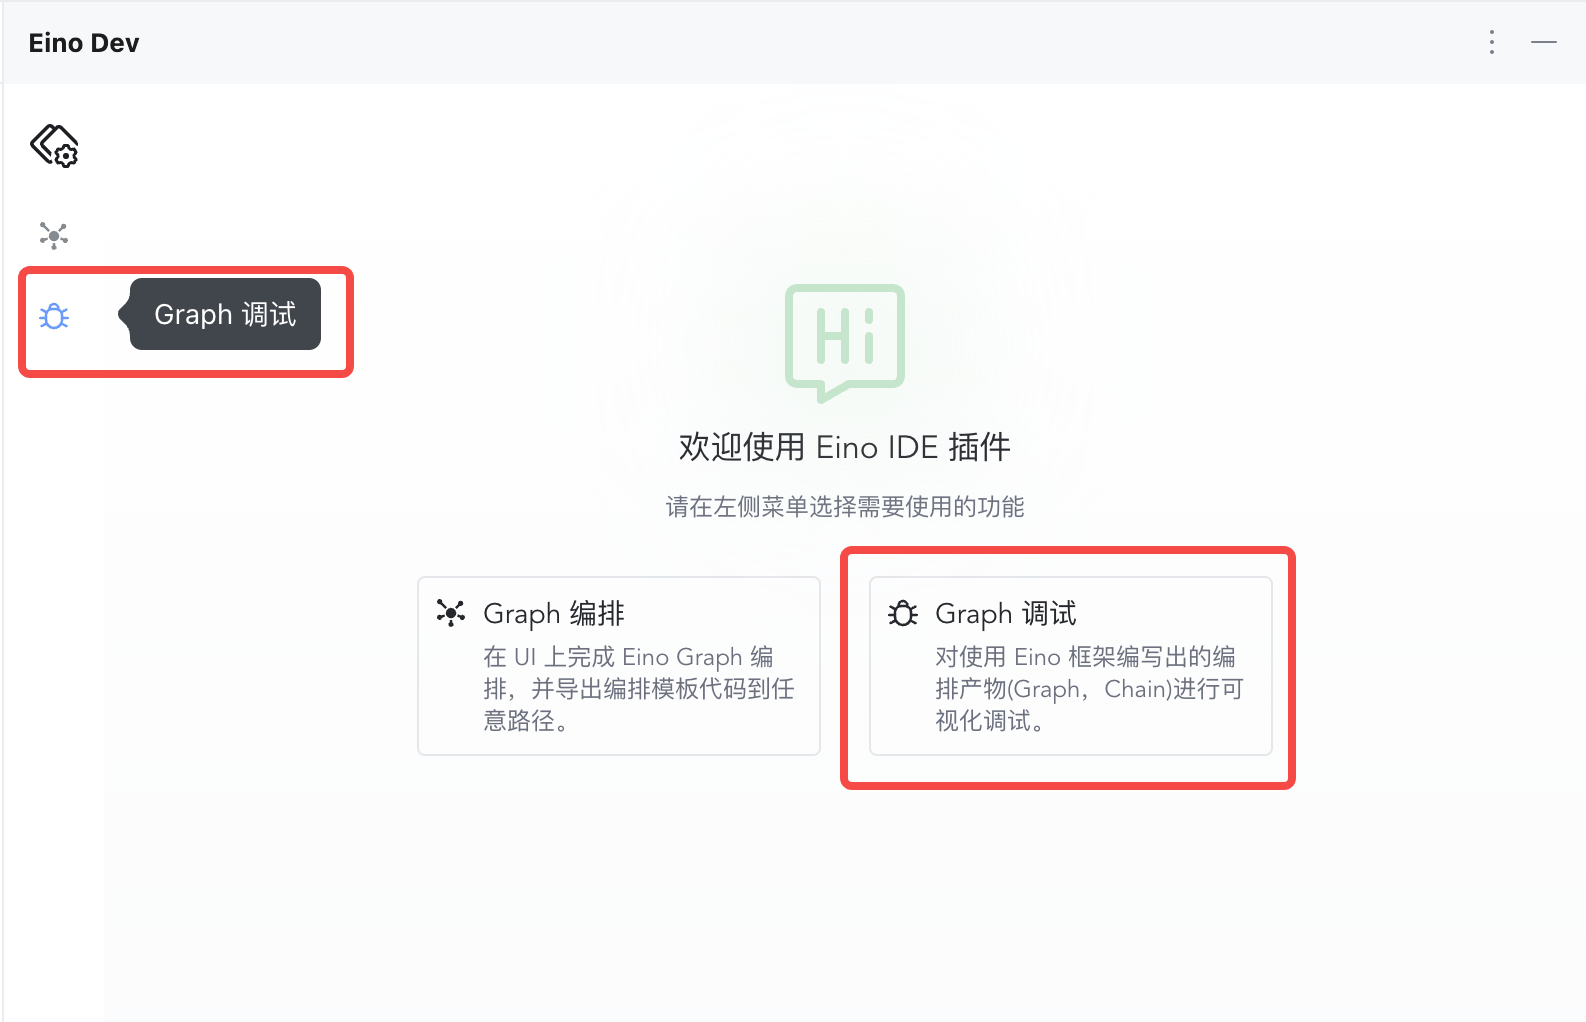
1. Click the debug feature on the left side or in the center to enter debug configuration
|
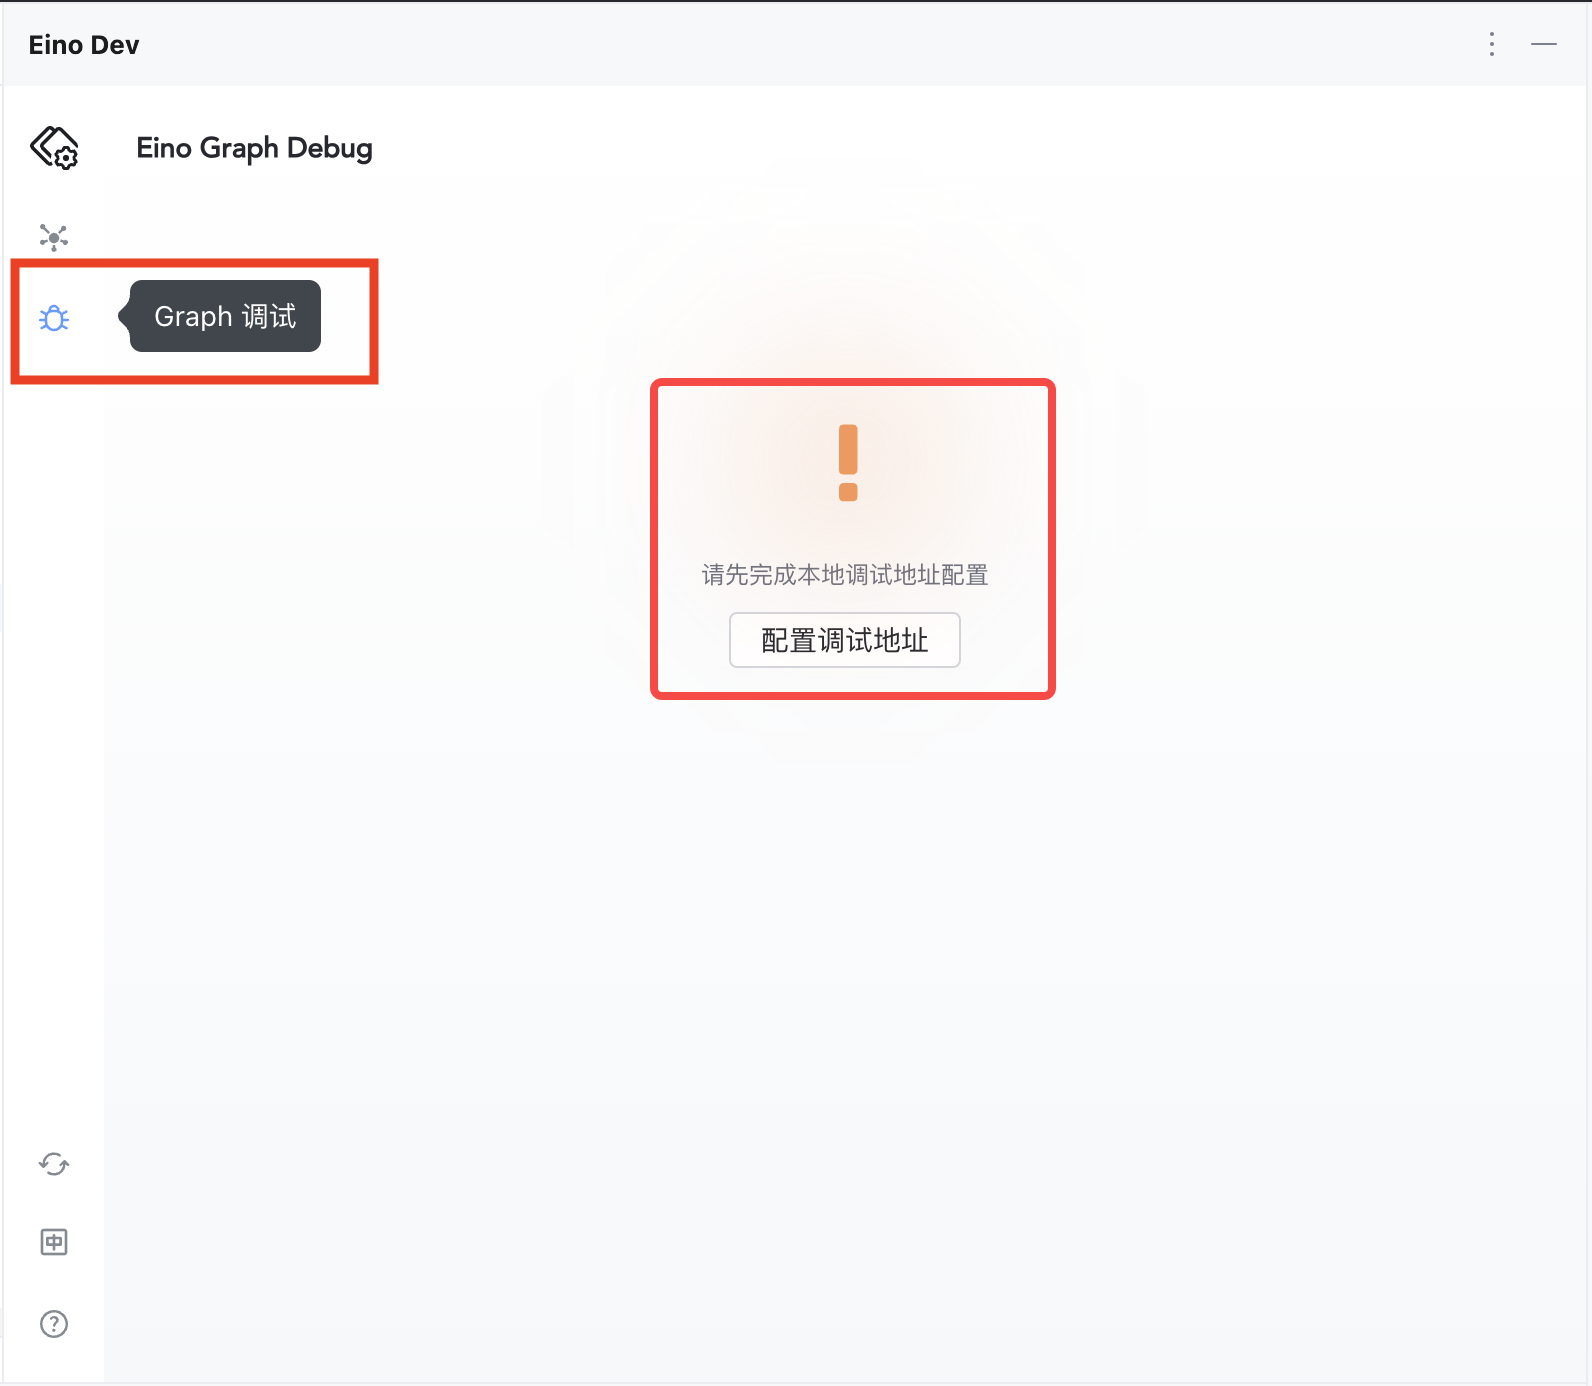
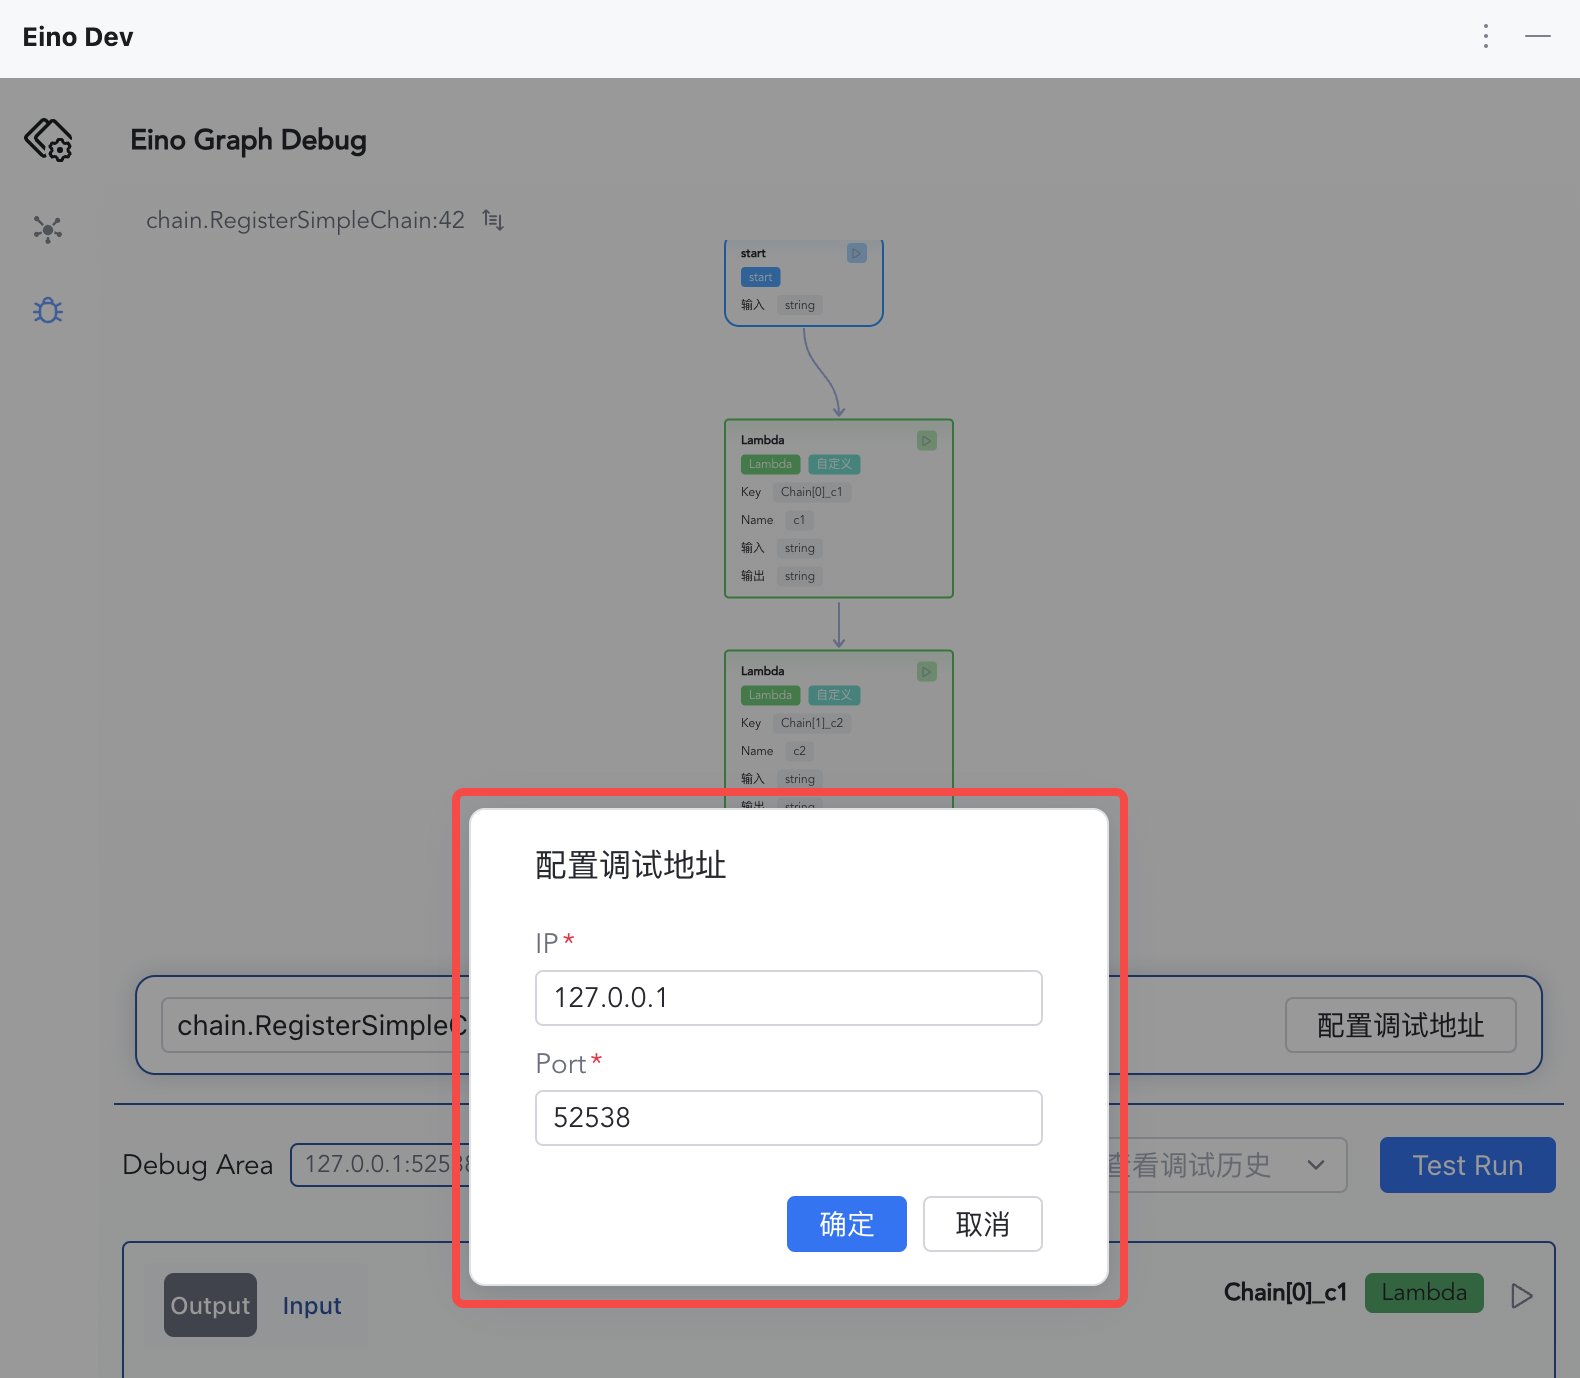
2. Click to configure the debug address
|
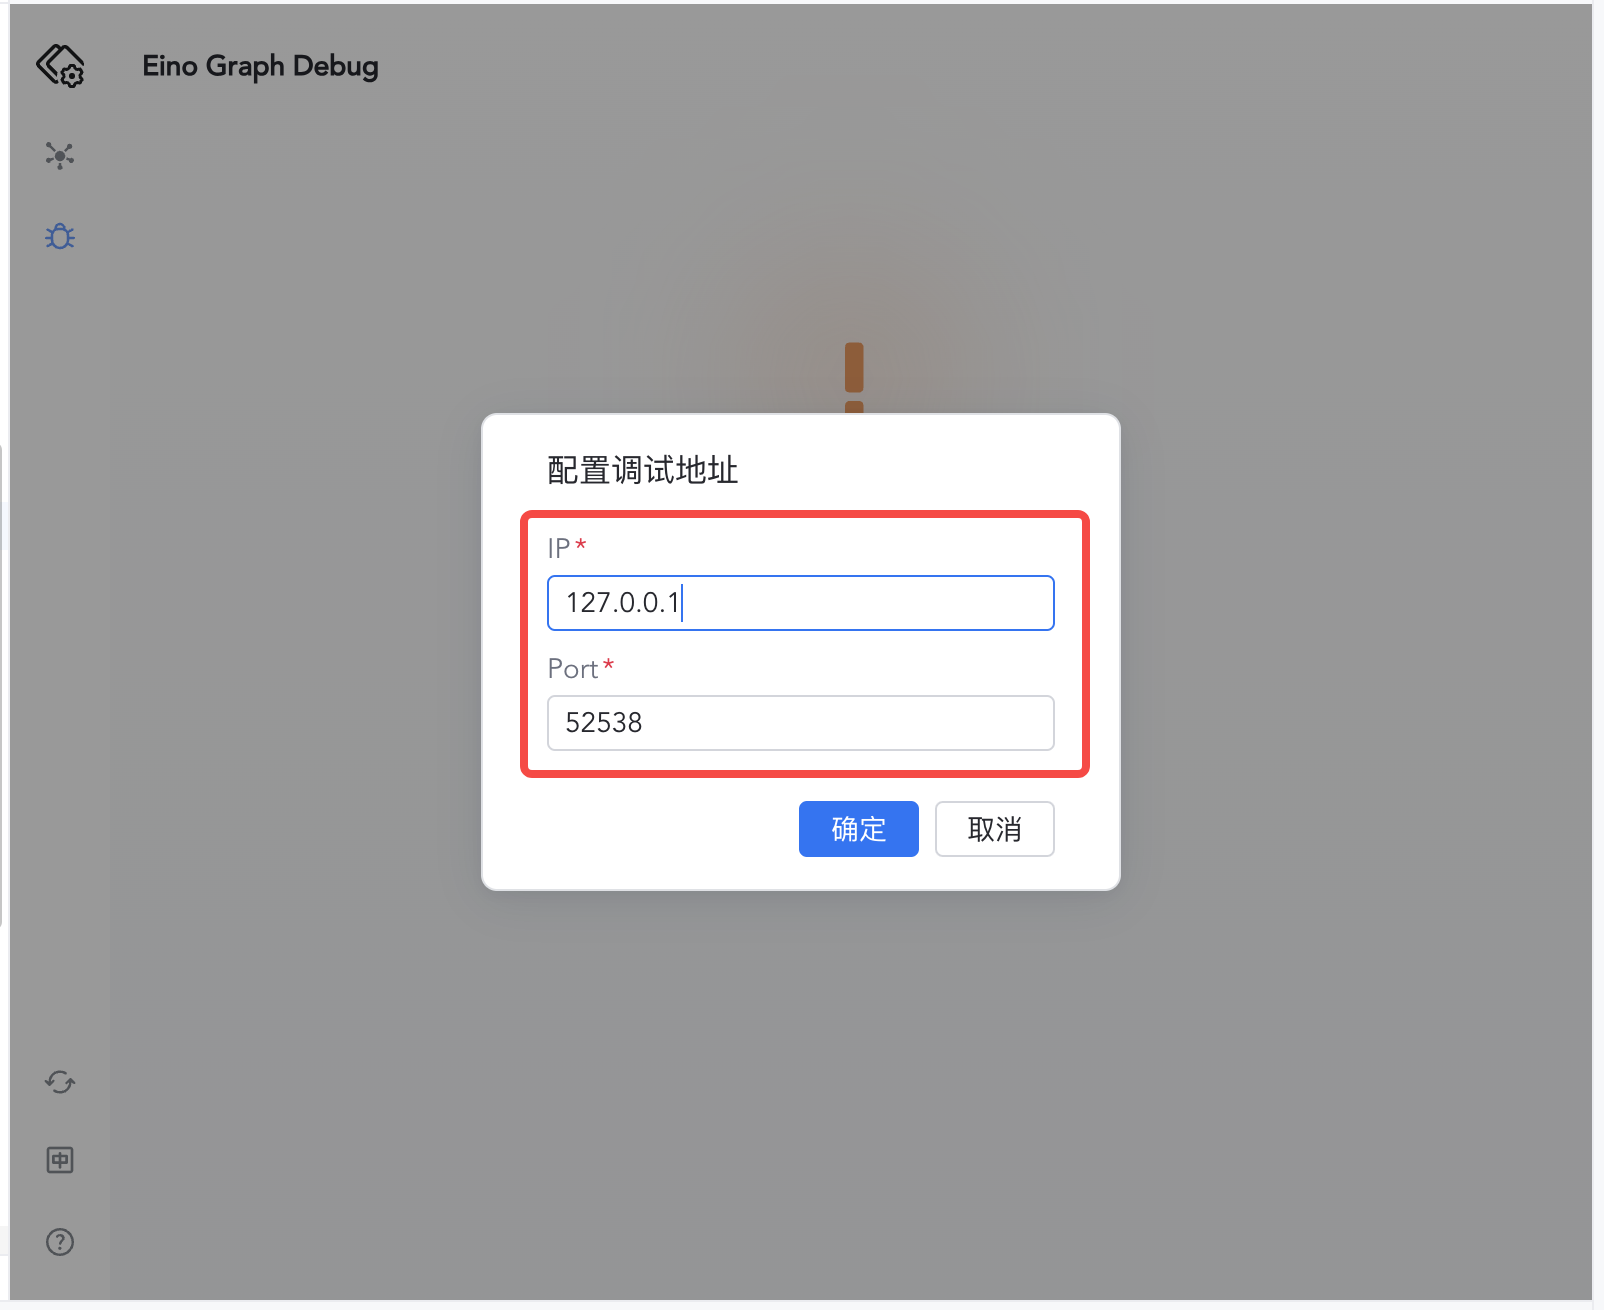
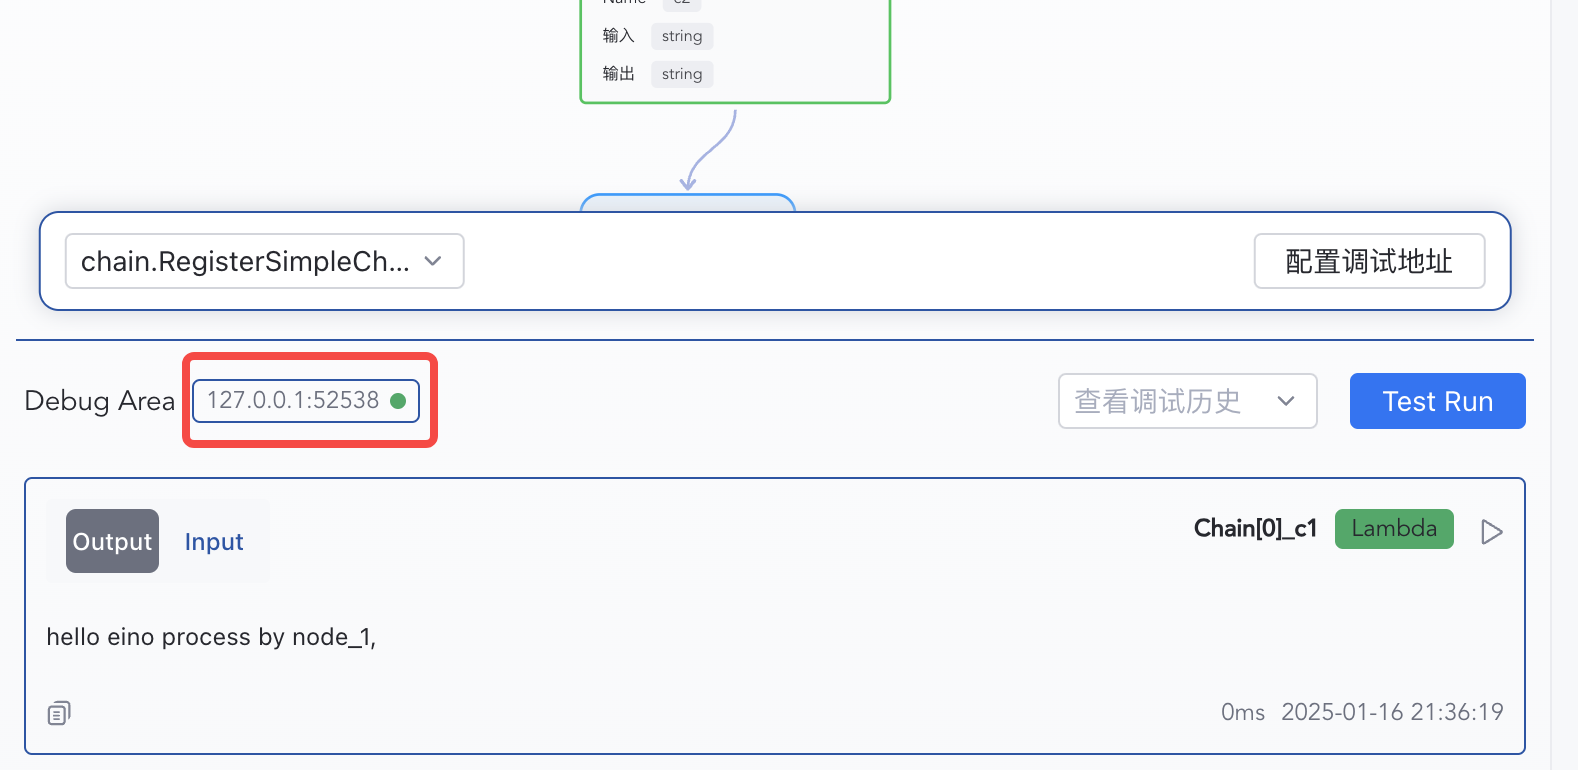
3. Enter 127.0.0.1:52538
|
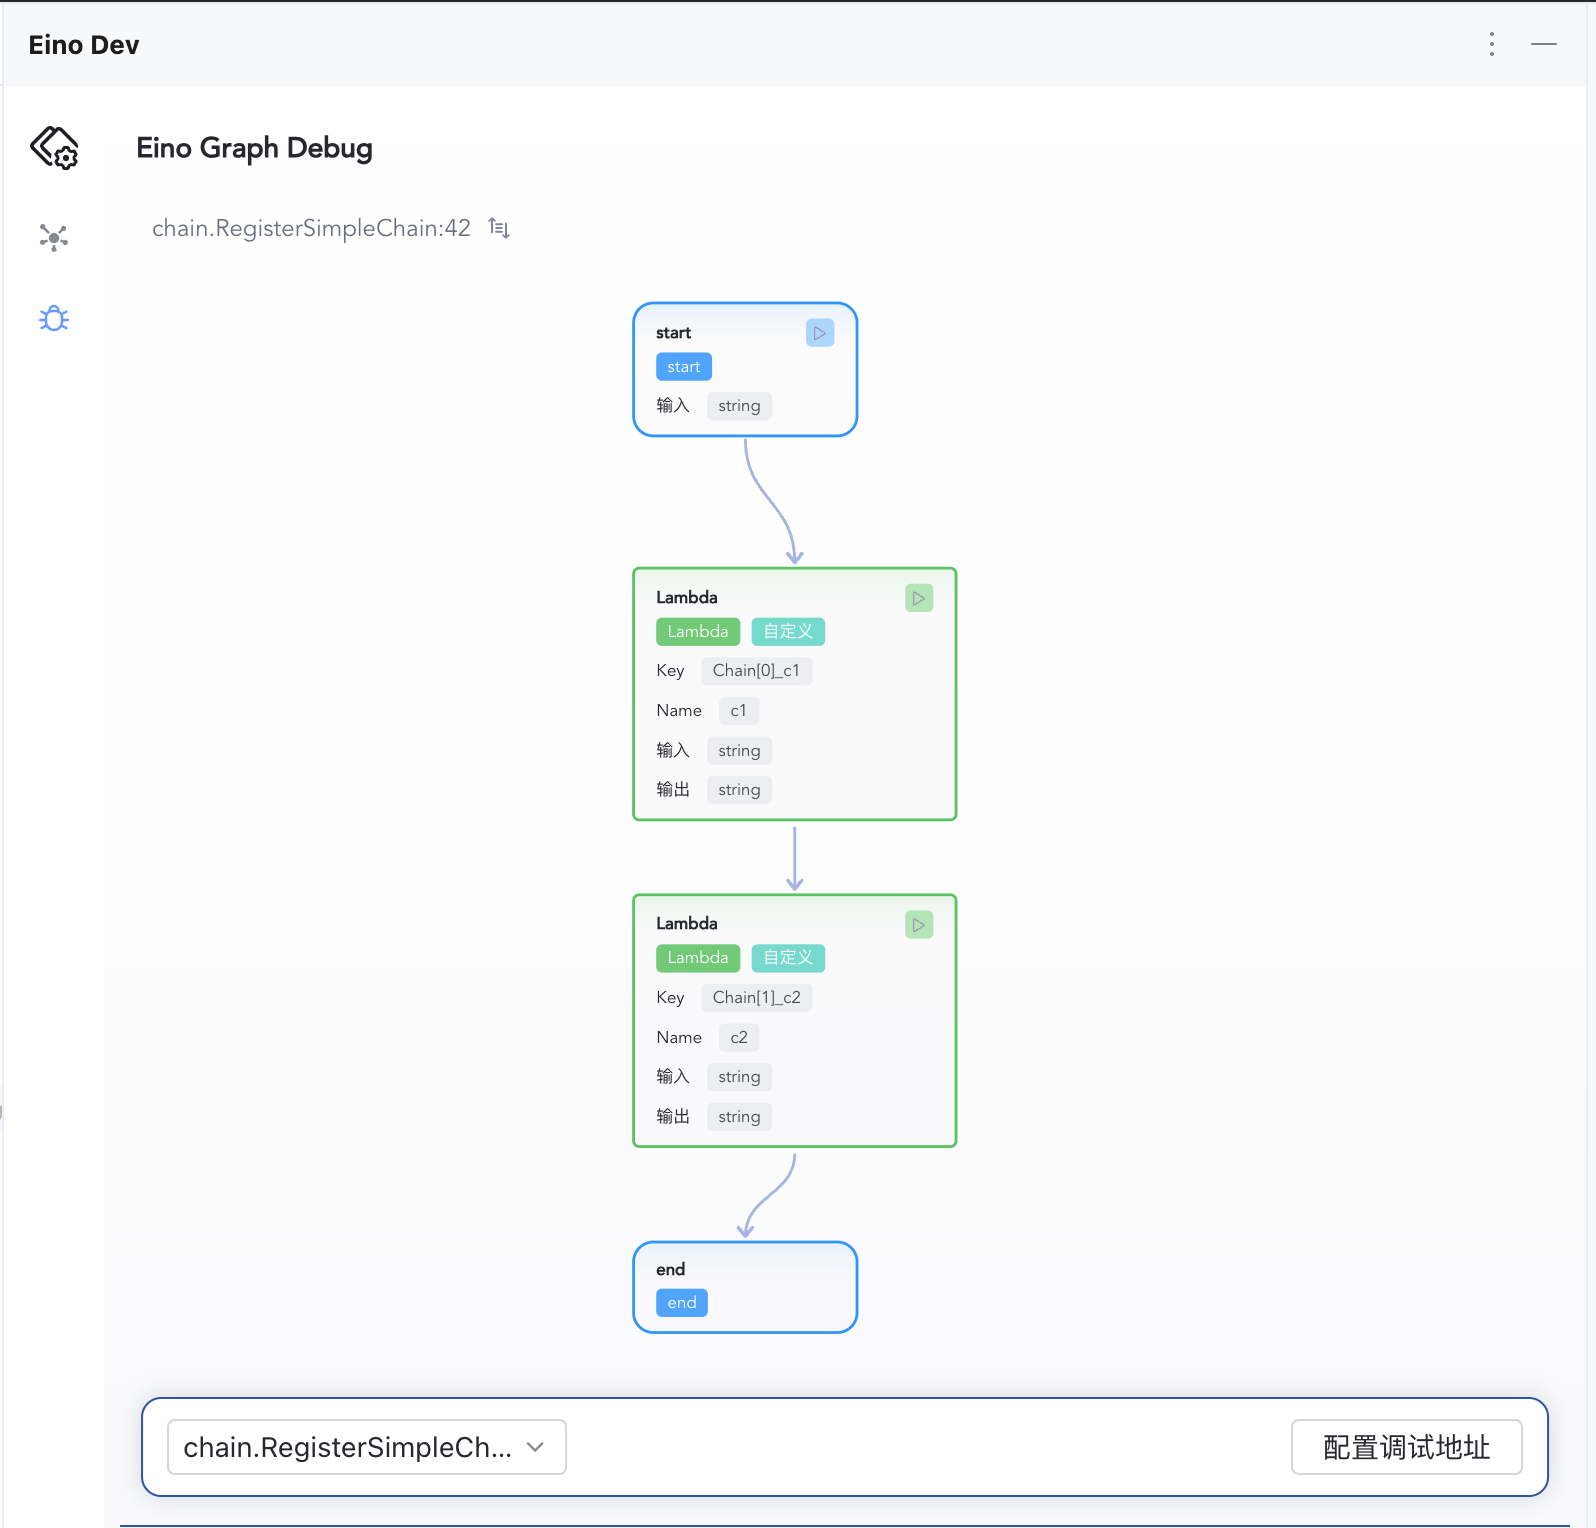
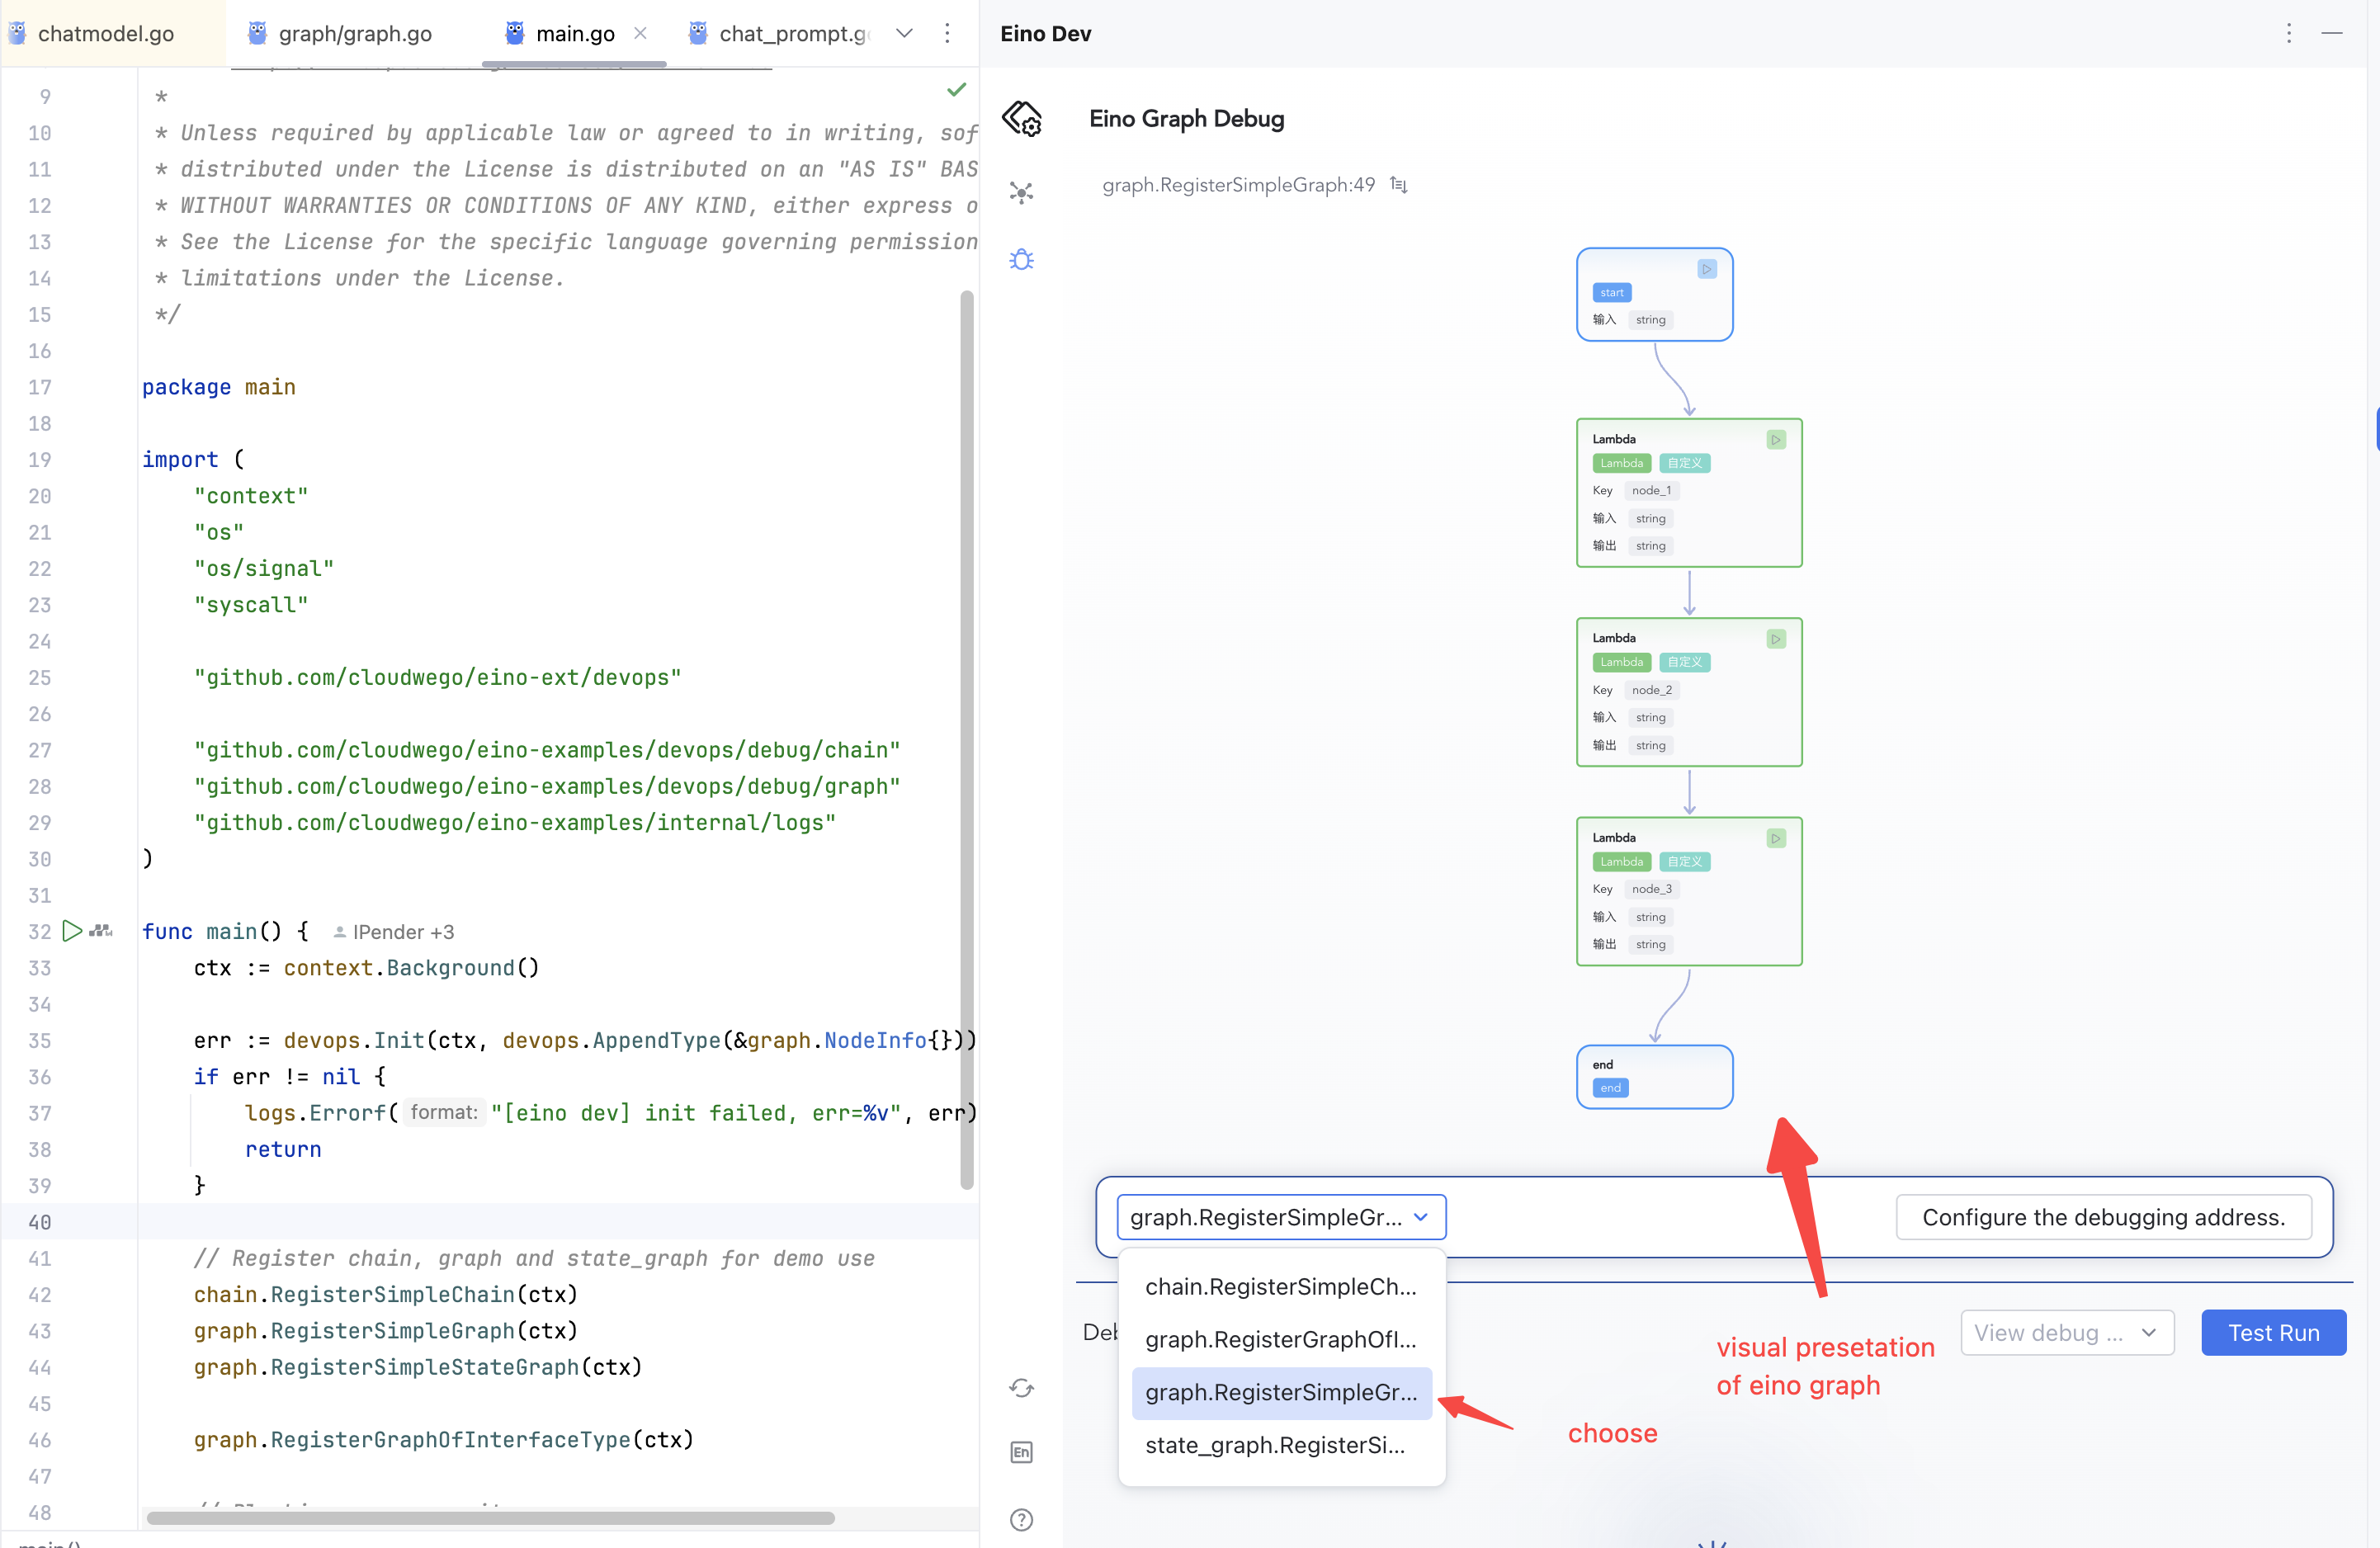
4. Click Confirm to enter the debug interface and select the Graph to debug
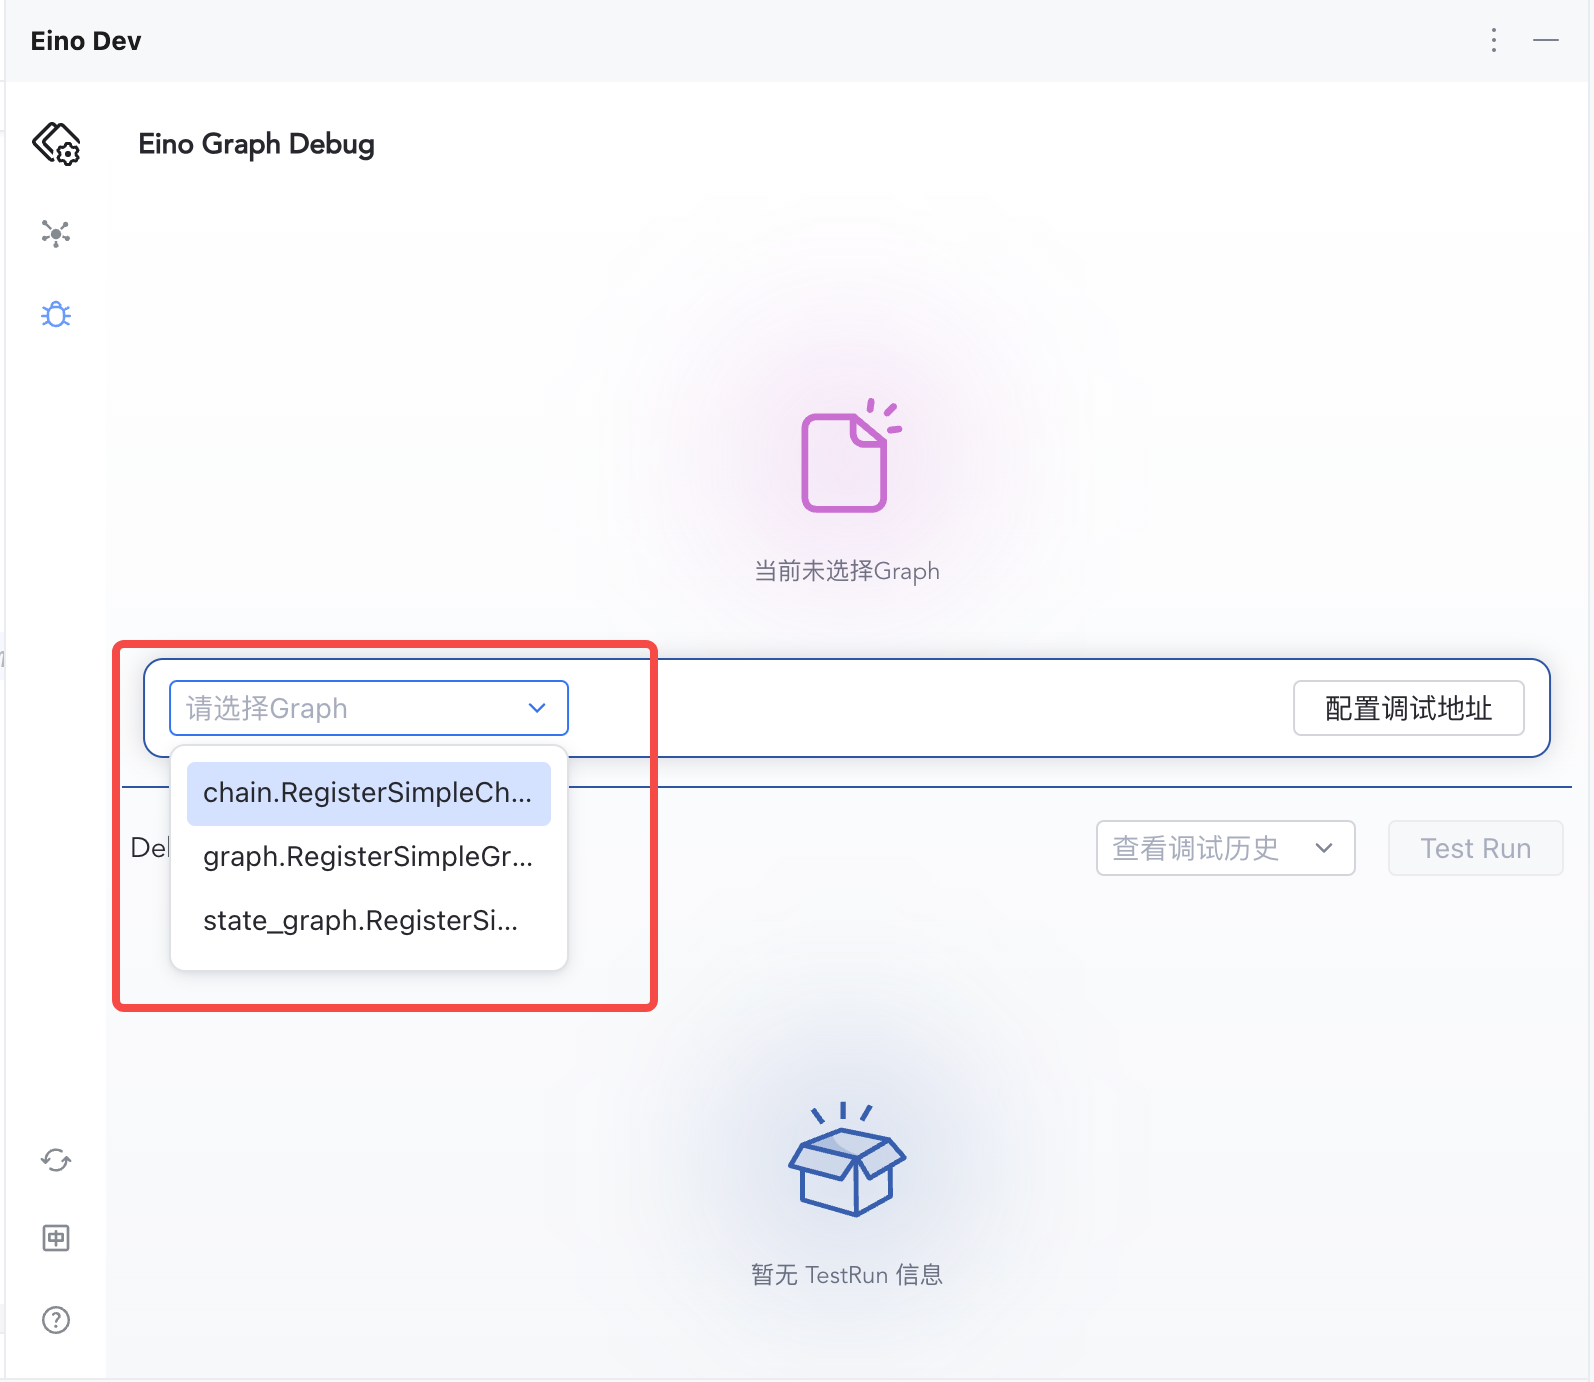
|
Start Debugging
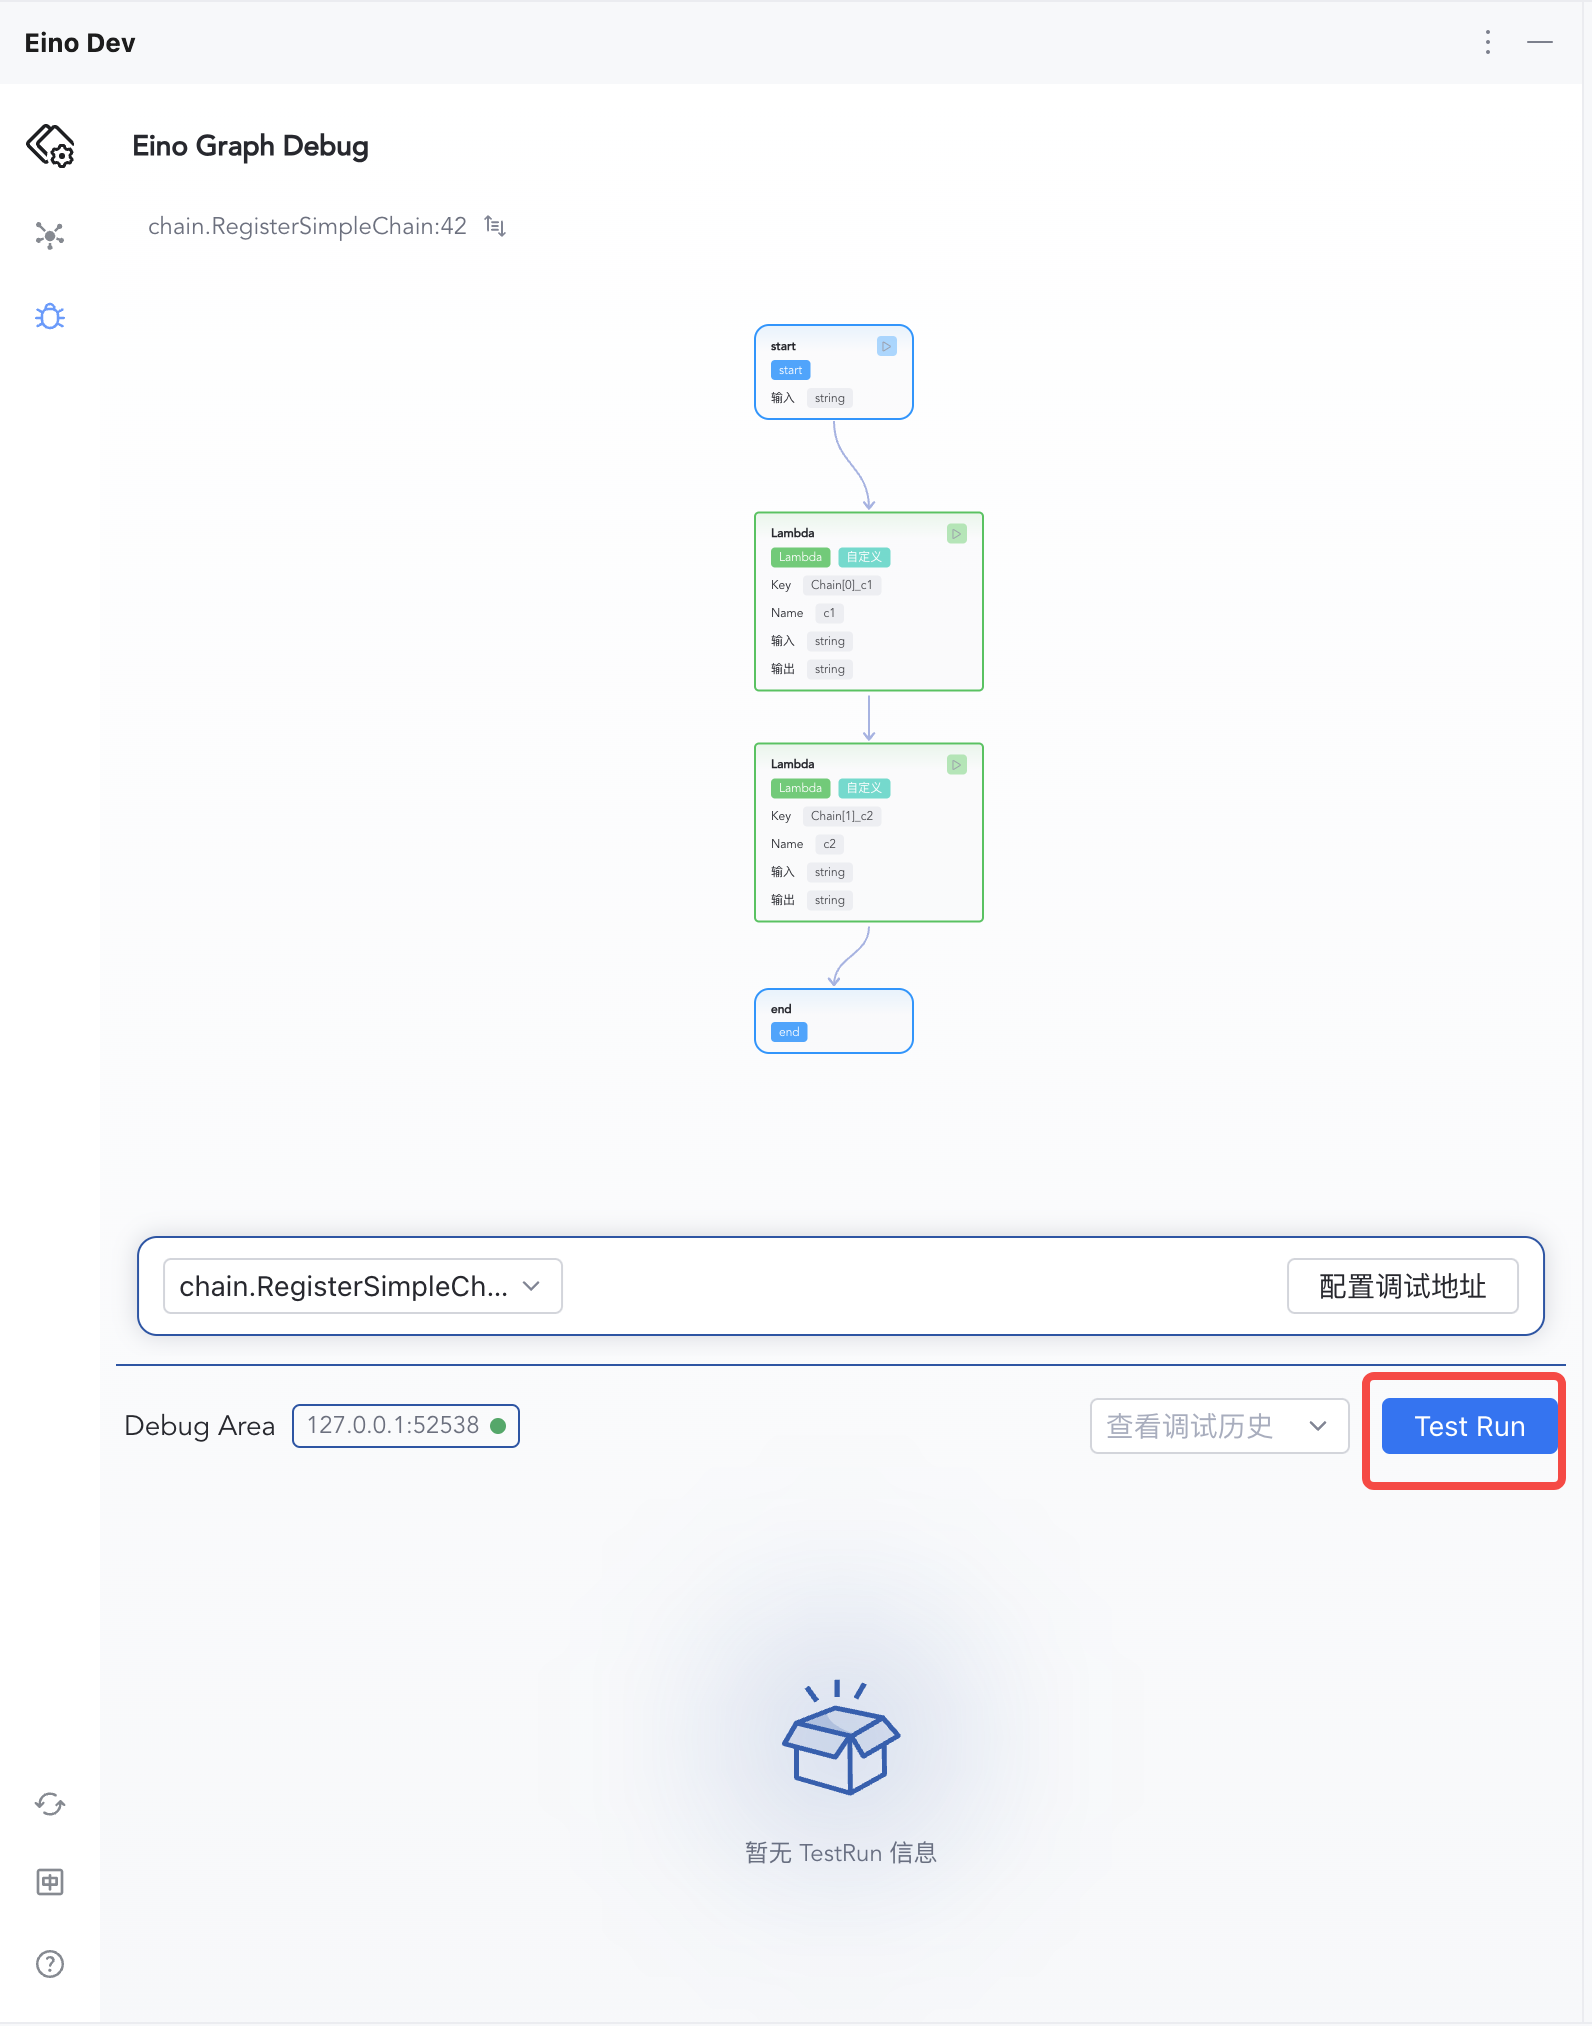
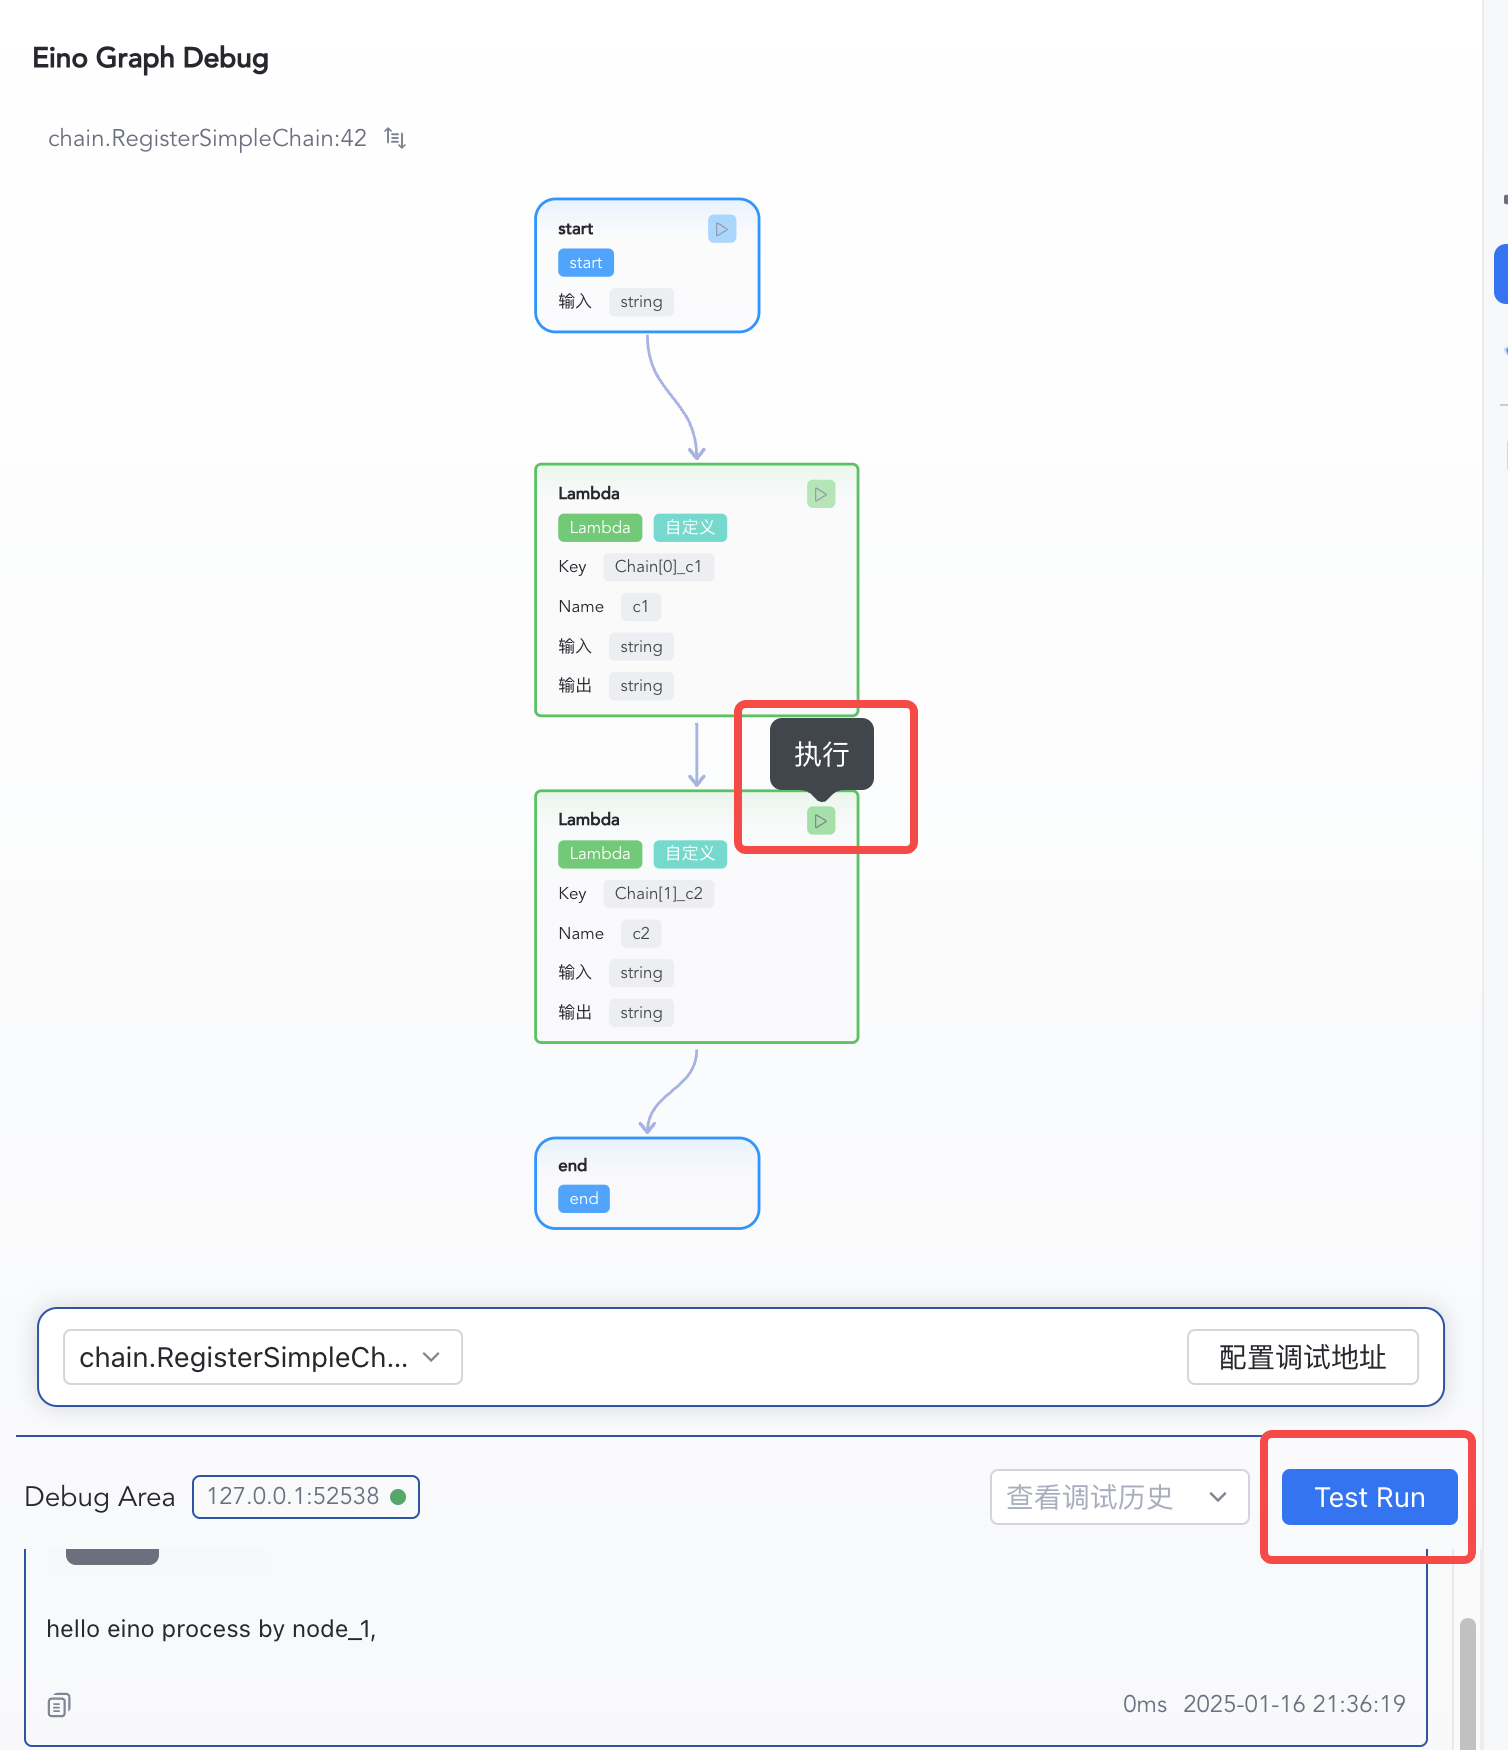
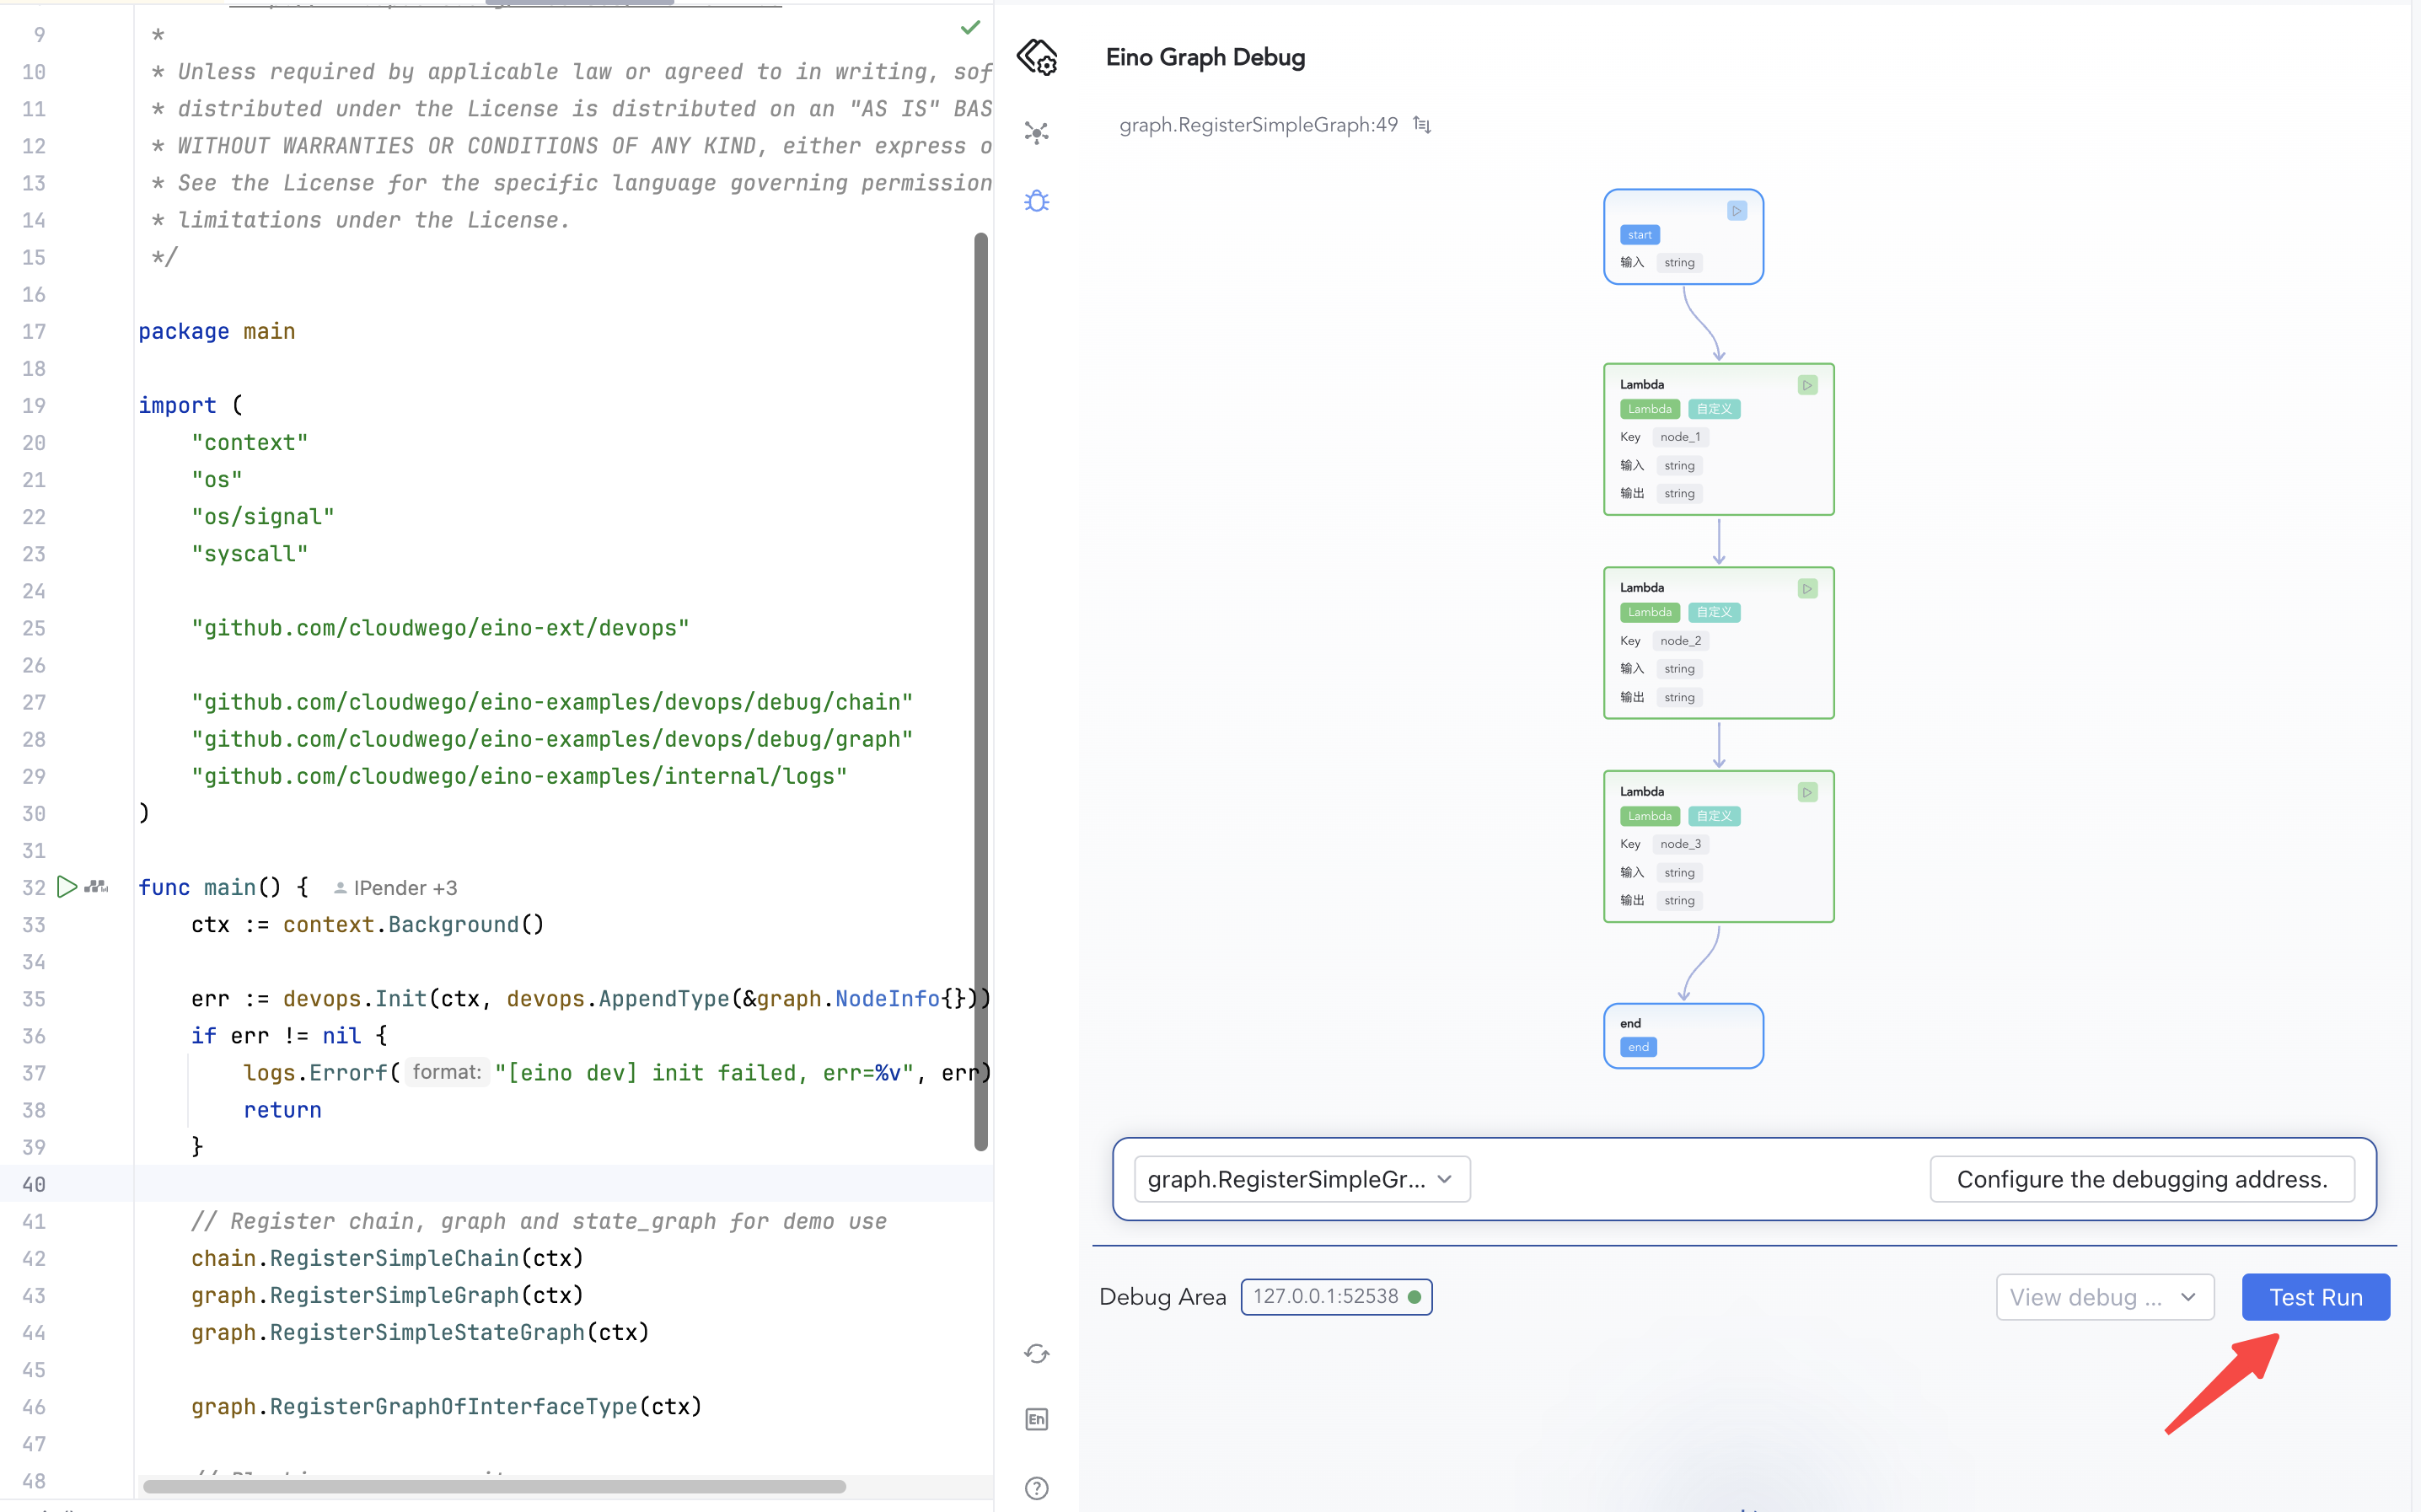
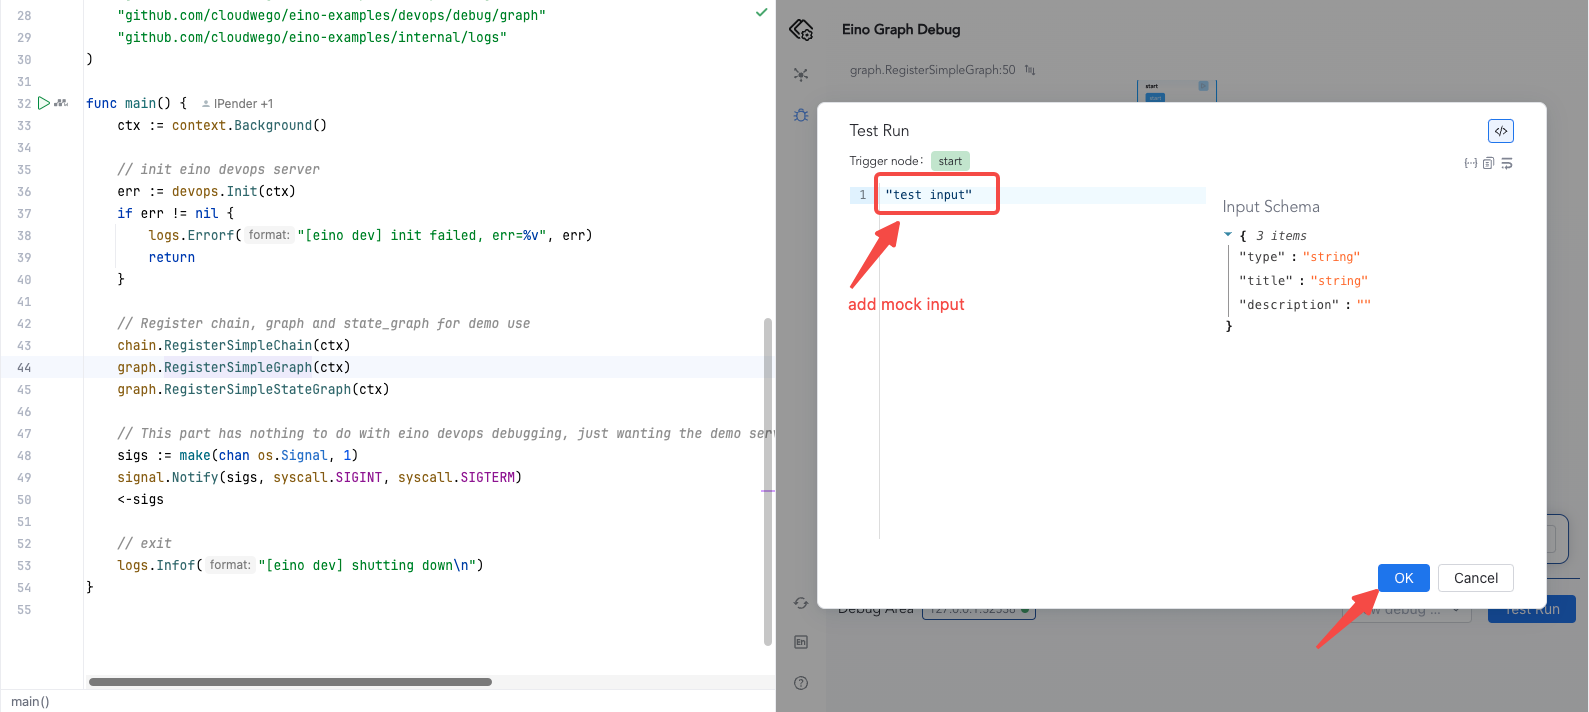
1. Click "Test Run" to start execution from the start node
|
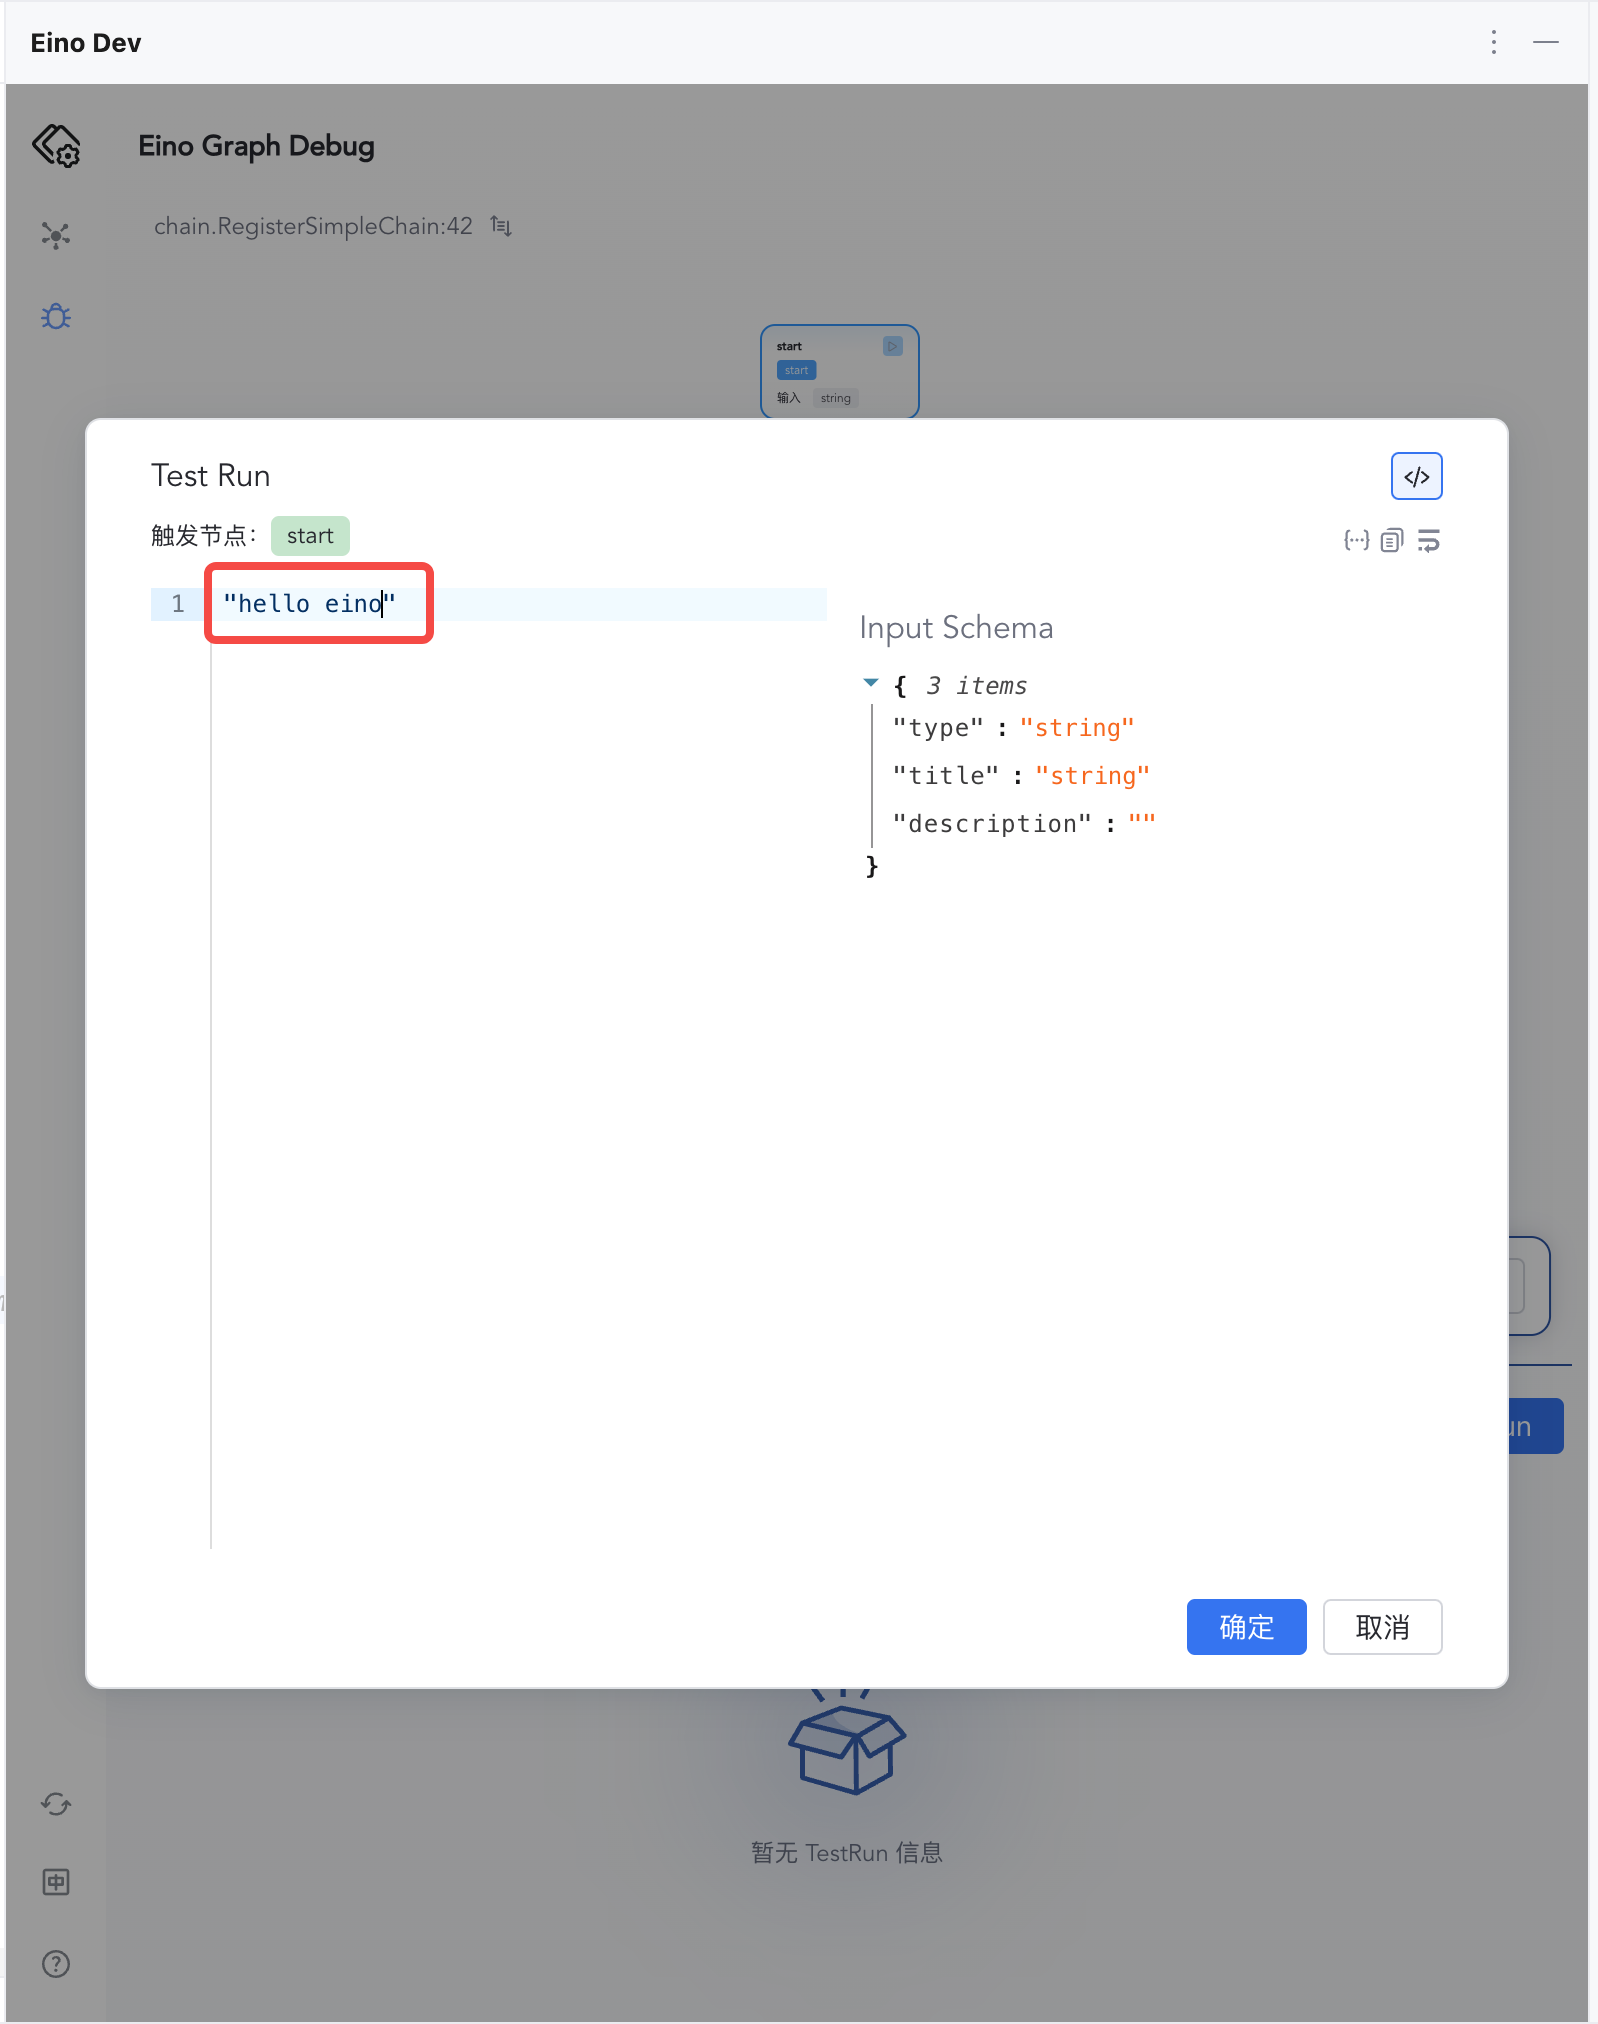
2. Enter "hello eino" and click Confirm
|
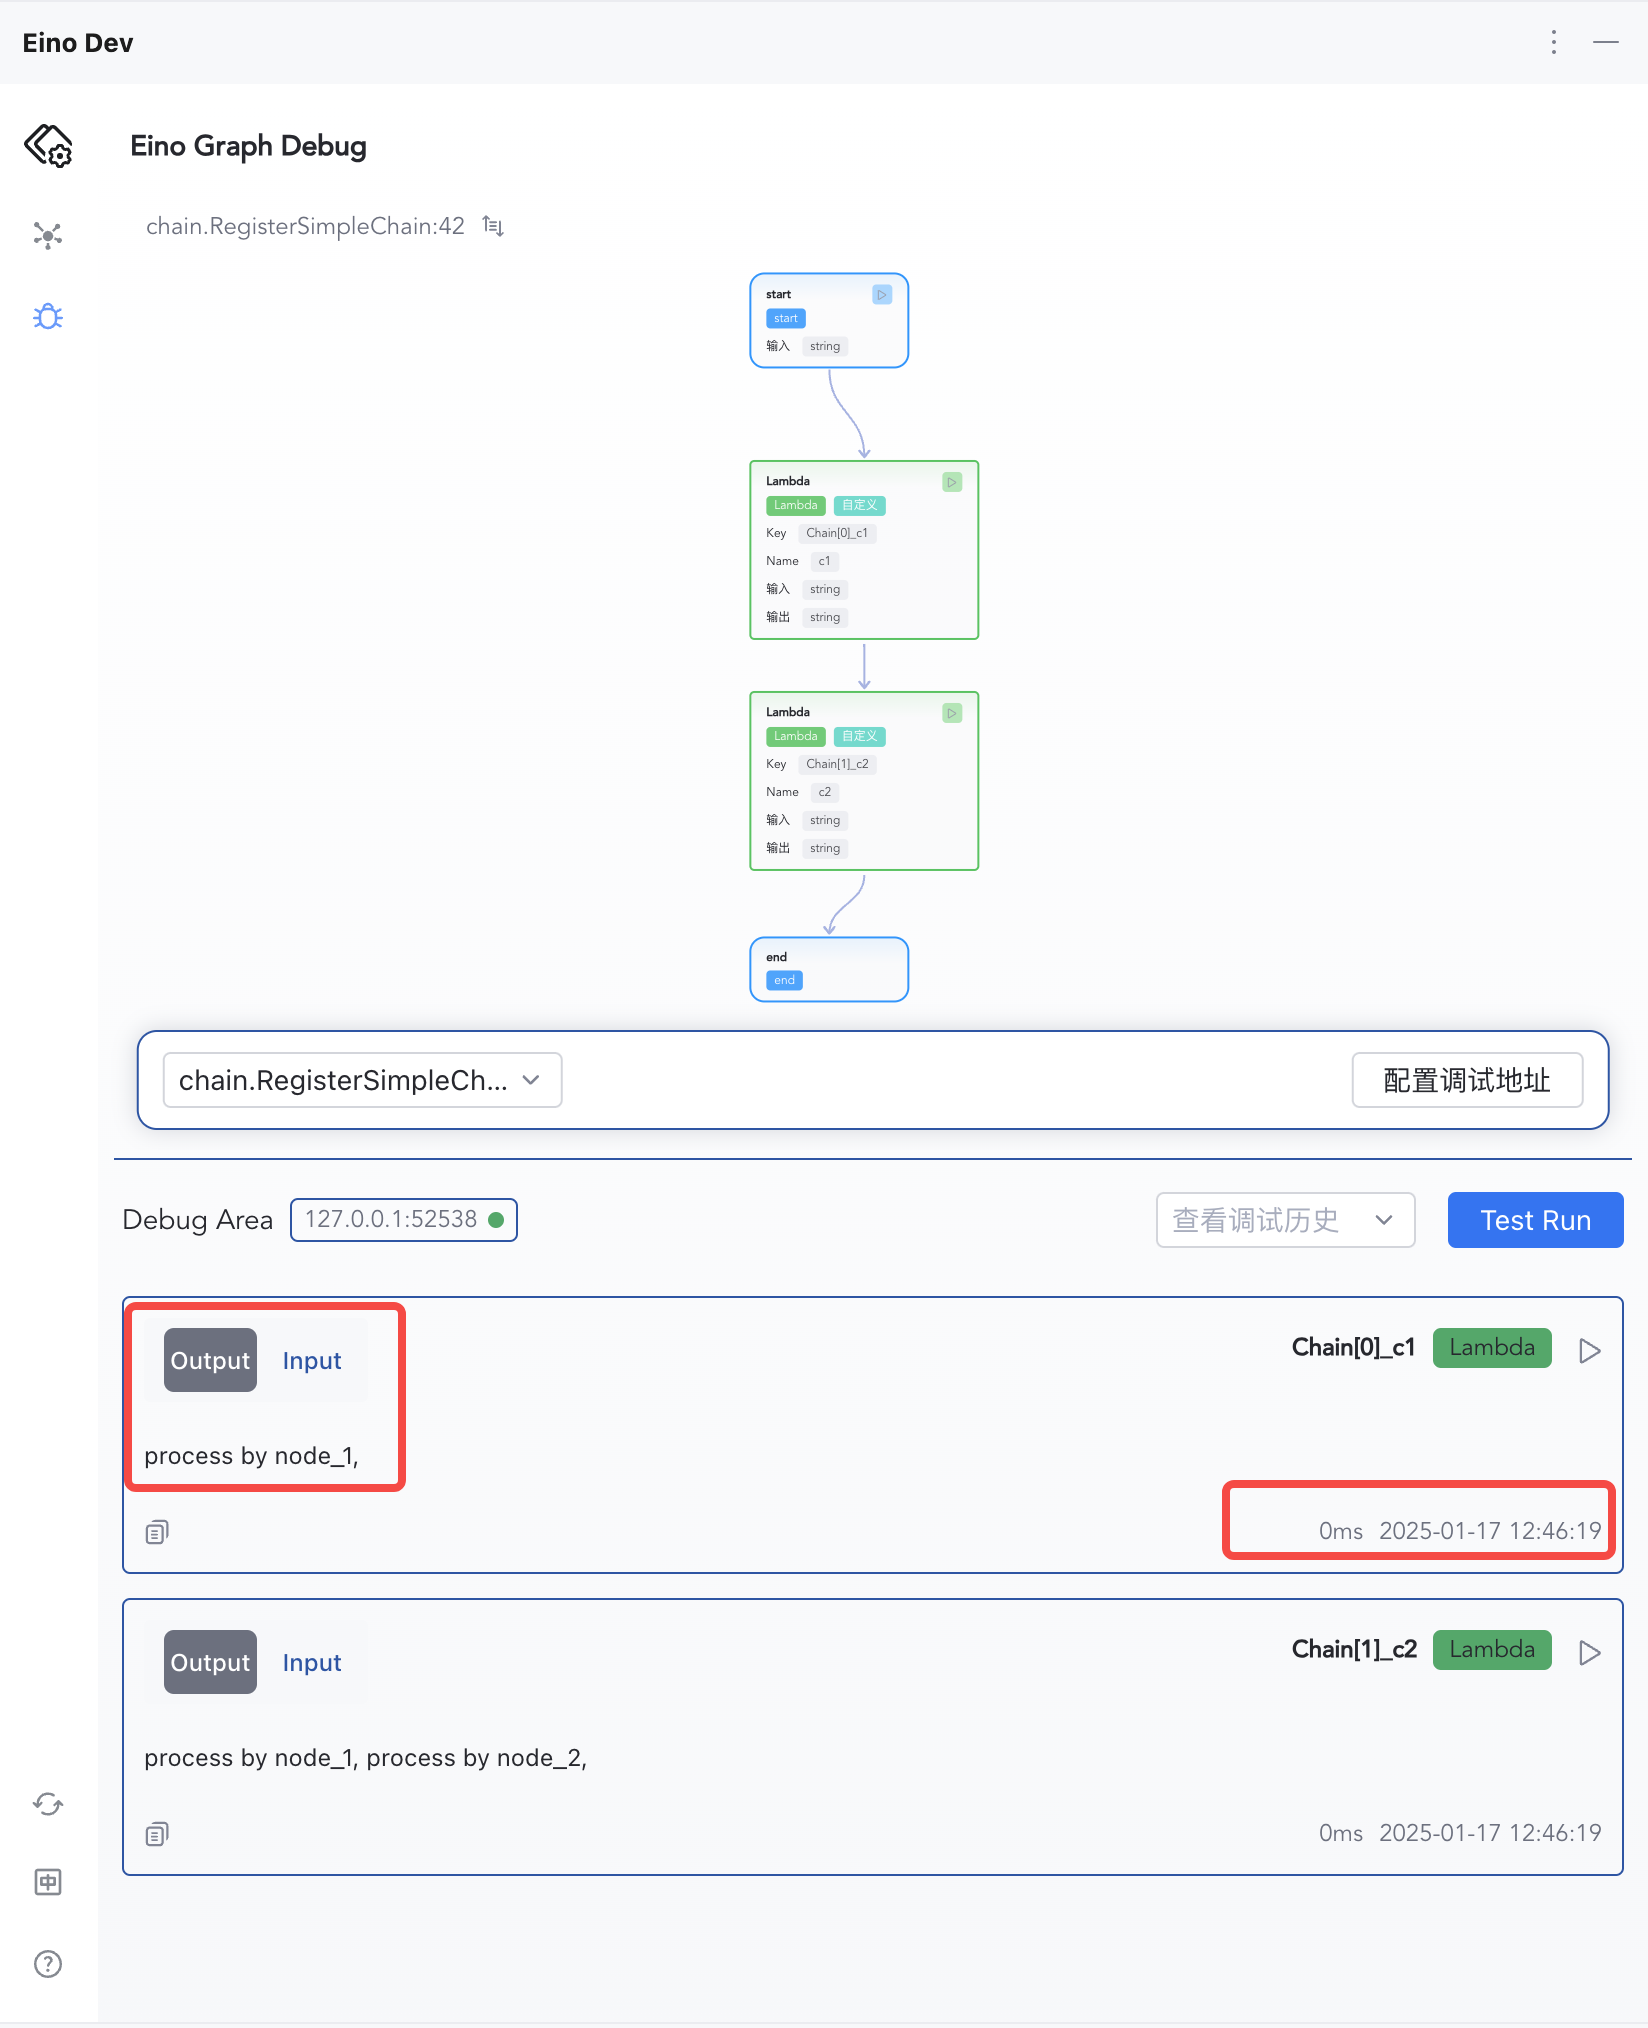
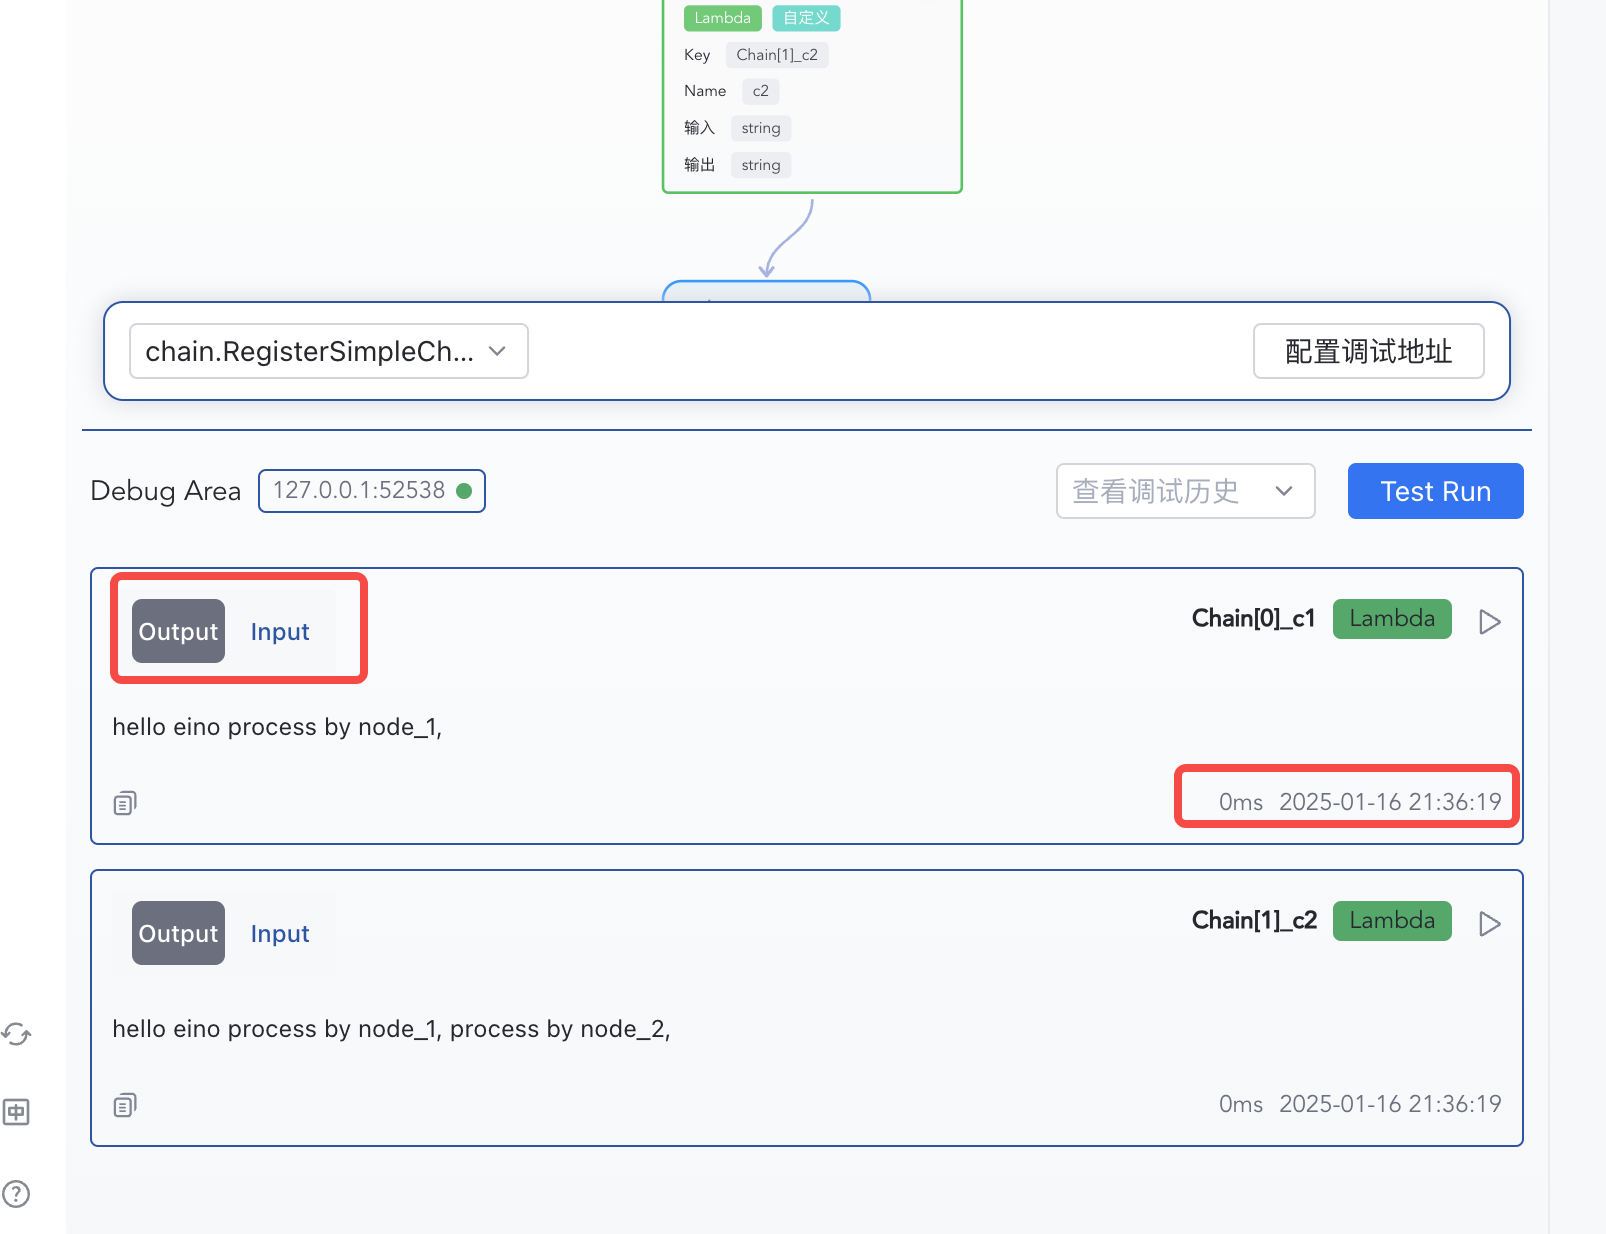
3. The debug area displays the input and output of each node
|
4. Click Input and Output to switch between viewing node information
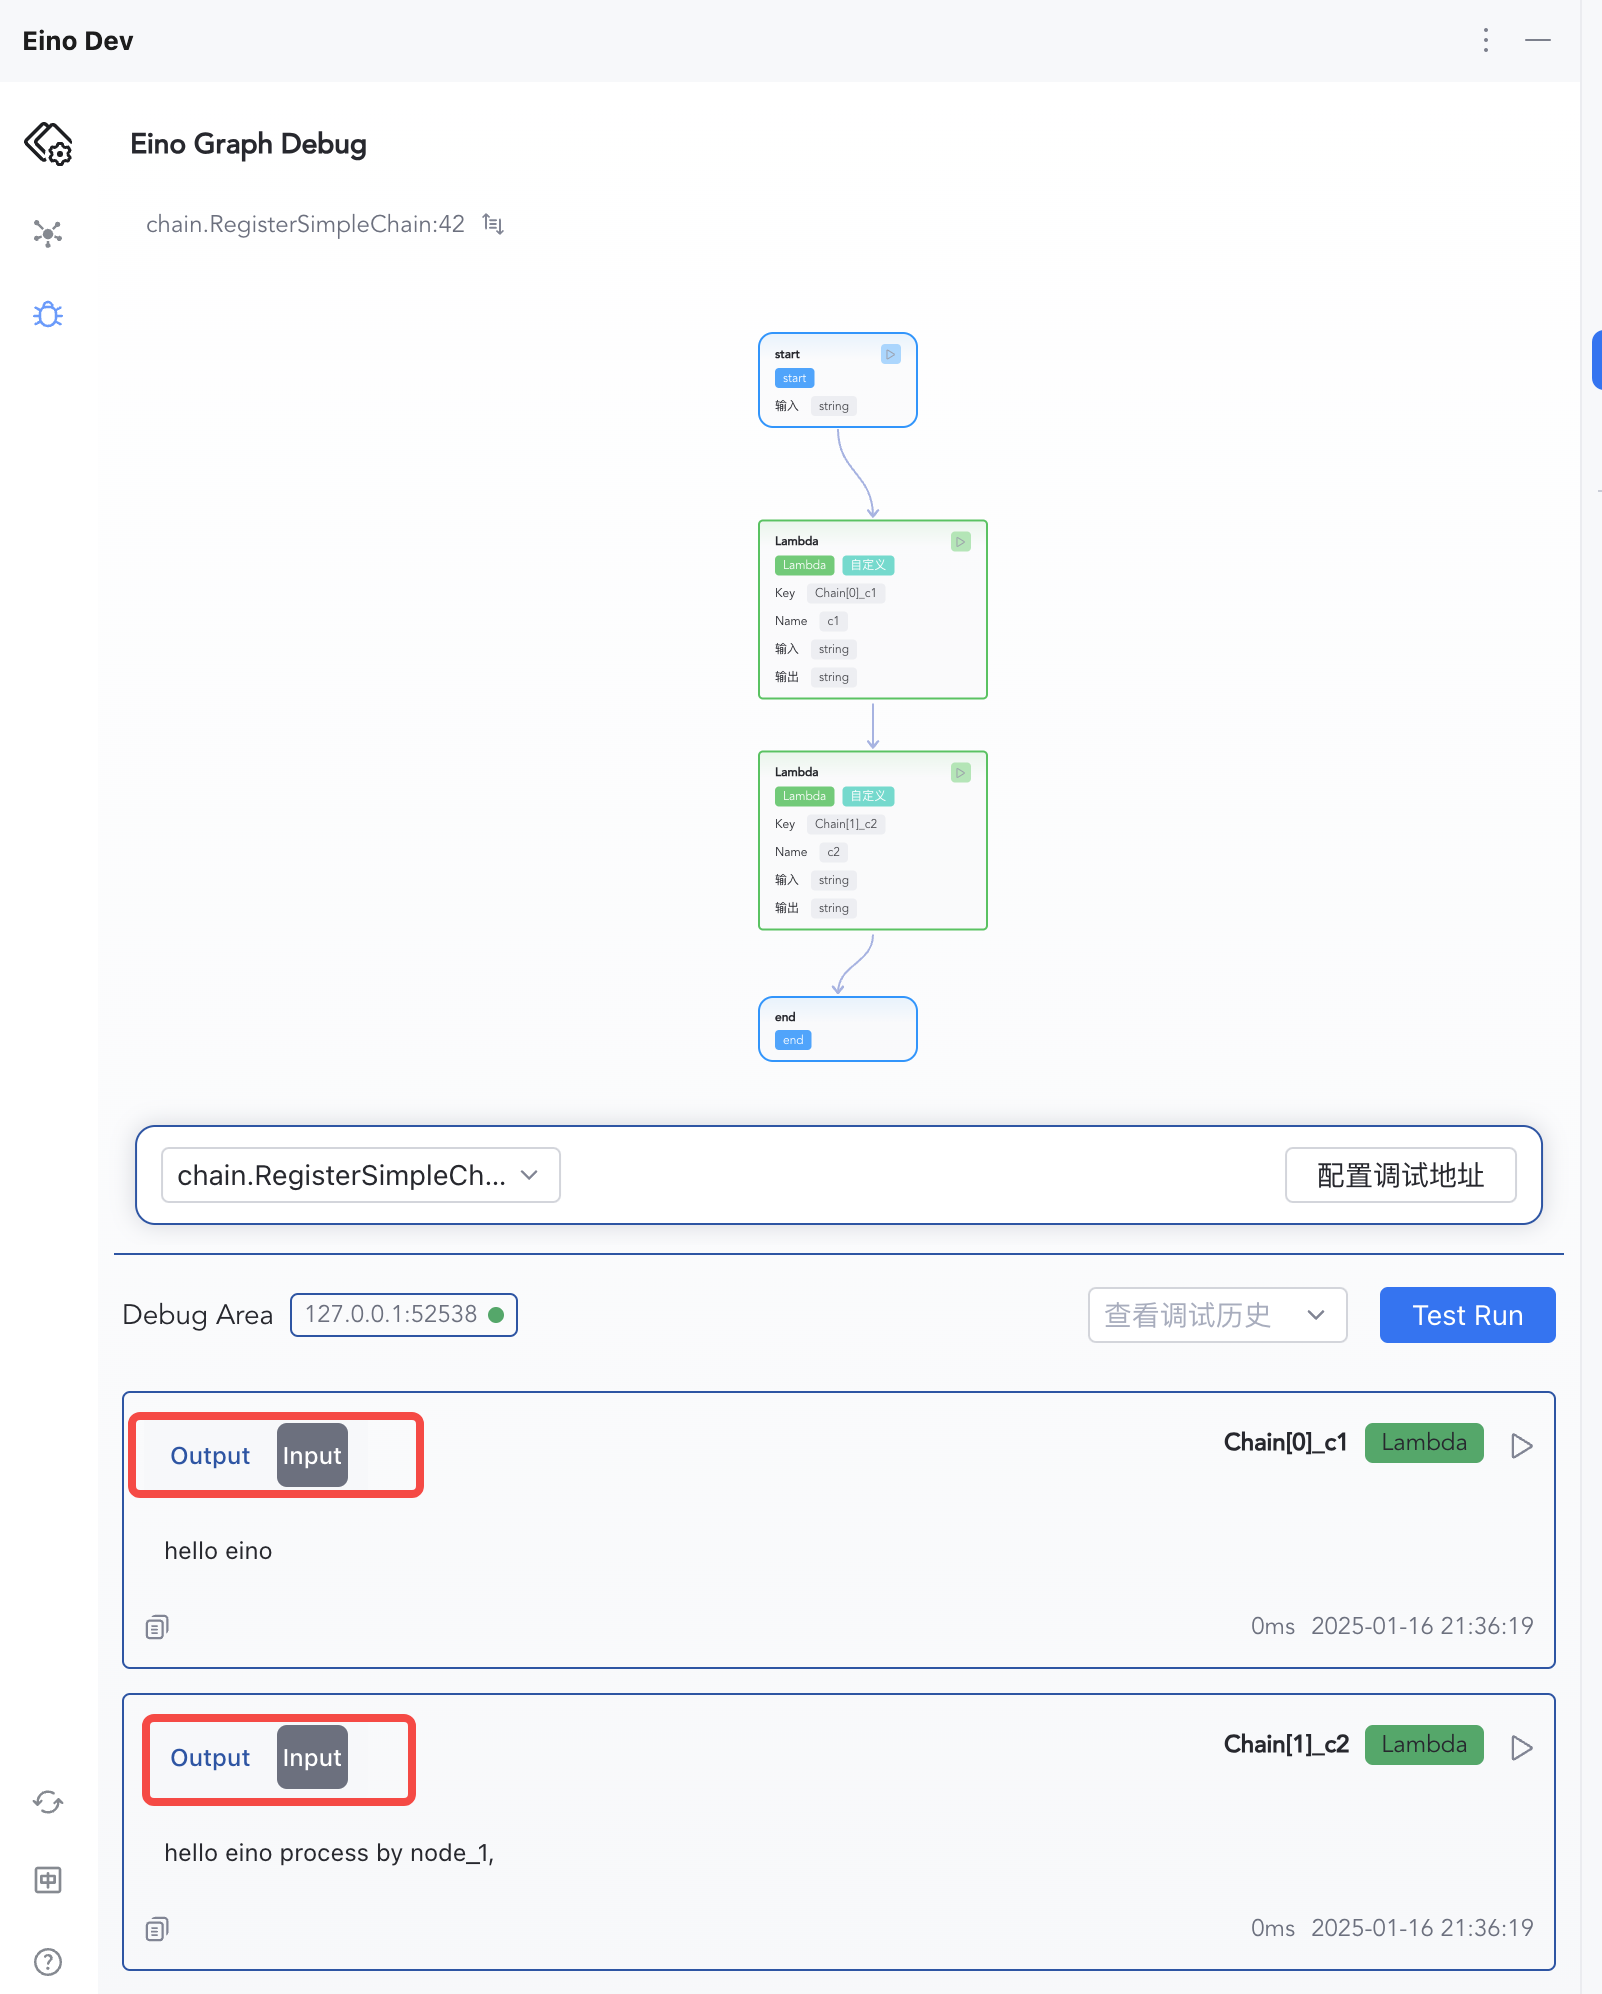
|
Feature Overview
Local or Remote Debugging
Whether the target orchestration artifact is running on a local machine or a remote server, you can actively connect to the server where the target is located by configuring IP:Port.
Orchestration Topology Visualization
Supports visualization of Graph and Chain orchestration topologies.
Debug from Any Node
View Node Execution Results
Each node’s execution result is displayed in the debug area in execution order, including: input, output, and execution time.
Debugging from Scratch
Orchestrate with Eino
The plugin supports debugging Graph and Chain orchestration artifacts. Suppose you already have orchestration code as follows:
func RegisterSimpleGraph(ctx context.Context) {
    g := compose.NewGraph[string, string]()
    _ = g.AddLambdaNode("node_1", compose.InvokableLambda(func(ctx context.Context, input string) (output string, err error) {
       return input + " process by node_1,", nil
    }))
    _ = g.AddLambdaNode("node_2", compose.InvokableLambda(func(ctx context.Context, input string) (output string, err error) {
       return input + " process by node_2,", nil
    }))
    _ = g.AddLambdaNode("node_3", compose.InvokableLambda(func(ctx context.Context, input string) (output string, err error) {
       return input + " process by node_3,", nil
    }))

    _ = g.AddEdge(compose.START, "node_1")
    _ = g.AddEdge("node_1", "node_2")
    _ = g.AddEdge("node_2", "node_3")
    _ = g.AddEdge("node_3", compose.END)

    _, err := g.Compile(ctx)
    if err != nil {
       logs.Errorf("compile graph failed, err=%v", err)
       return
    }
}
Install Dependencies
Run the following commands in order in the project directory:
# 1. Pull latest devops repository
go get github.com/cloudwego/eino-ext/devops@latest

# 2. Cleans and updates go.mod and go.sum
go mod tidy
Call the Debug Initialization Function
Because debugging requires starting an HTTP service in the user’s main process to interact with the local debug plugin, you need to call Init() from github.com/cloudwego/eino-ext/devops once to start the debug service.
💡 Notes
- Ensure the target orchestration artifact has been
Compile()d at least once.devops.Init()must be executed before callingCompile().- You must ensure the main process does not exit after
devops.Init()is executed.- Starting from v0.1.9, the default listening address for the debug service changed from
0.0.0.0to127.0.0.1(local connections only). For remote debugging, explicitly specify the listening IP viaWithDevServerIP, for example:devops.Init(ctx, devops.WithDevServerIP("0.0.0.0")).
Add debug service startup code in the main() function, for example:
// 1. Call the debug service initialization function
err := devops.Init(ctx)
if err != nil {
    logs.Errorf("[eino dev] init failed, err=%v", err)
    return
}

// 2. Compile the target orchestration artifact for debugging
RegisterSimpleGraph(ctx)
Run the User Process
Run your process on a local machine or remote environment, and ensure the main process does not exit.
In github.com/cloudwego/eino-examples/devops/debug/main.go, the main() code is as follows:
func main() {
    ctx := context.Background()
    // Init eino devops server
    err := devops.Init(ctx)
    if err != nil {
       logs.Errorf("[eino dev] init failed, err=%v", err)
       return
    }

    // Register chain, graph and state_graph for demo use
    chain.RegisterSimpleChain(ctx)
    graph.RegisterSimpleGraph(ctx)
    graph.RegisterSimpleStateGraph(ctx)

    // Blocking process exits
    sigs := make(chan os.Signal, 1)
    signal.Notify(sigs, syscall.SIGINT, syscall.SIGTERM)
    <-sigs

    // Exit
    logs.Infof("[eino dev] shutting down\n")
}
Configure the Debug Address
- IP: The IP address of the server where the user process is running.
- If the user process is running on the local machine, enter
127.0.0.1; - If the user process is running on a remote server, enter the remote server’s IP address, compatible with both IPv4 and IPv6.
- If the user process is running on the local machine, enter
- Port: The port the debug service listens on. The default is
52538, which can be changed via theWithDevServerPortoption.
💡 Notes
- Local debugging: The system may pop up a network access warning — simply allow access.
- Remote server debugging: Ensure the port is accessible. Additionally, starting from v0.1.9, the default listening address is
127.0.0.1only. For remote debugging, you must specify an IP accessible from the remote end (e.g.,0.0.0.0) viaWithDevServerIPwhen callingdevops.Init().
After configuring IP and Port, click Confirm. The debug plugin will automatically connect to the target debug server. If the connection is successful, the connection status indicator will turn green.
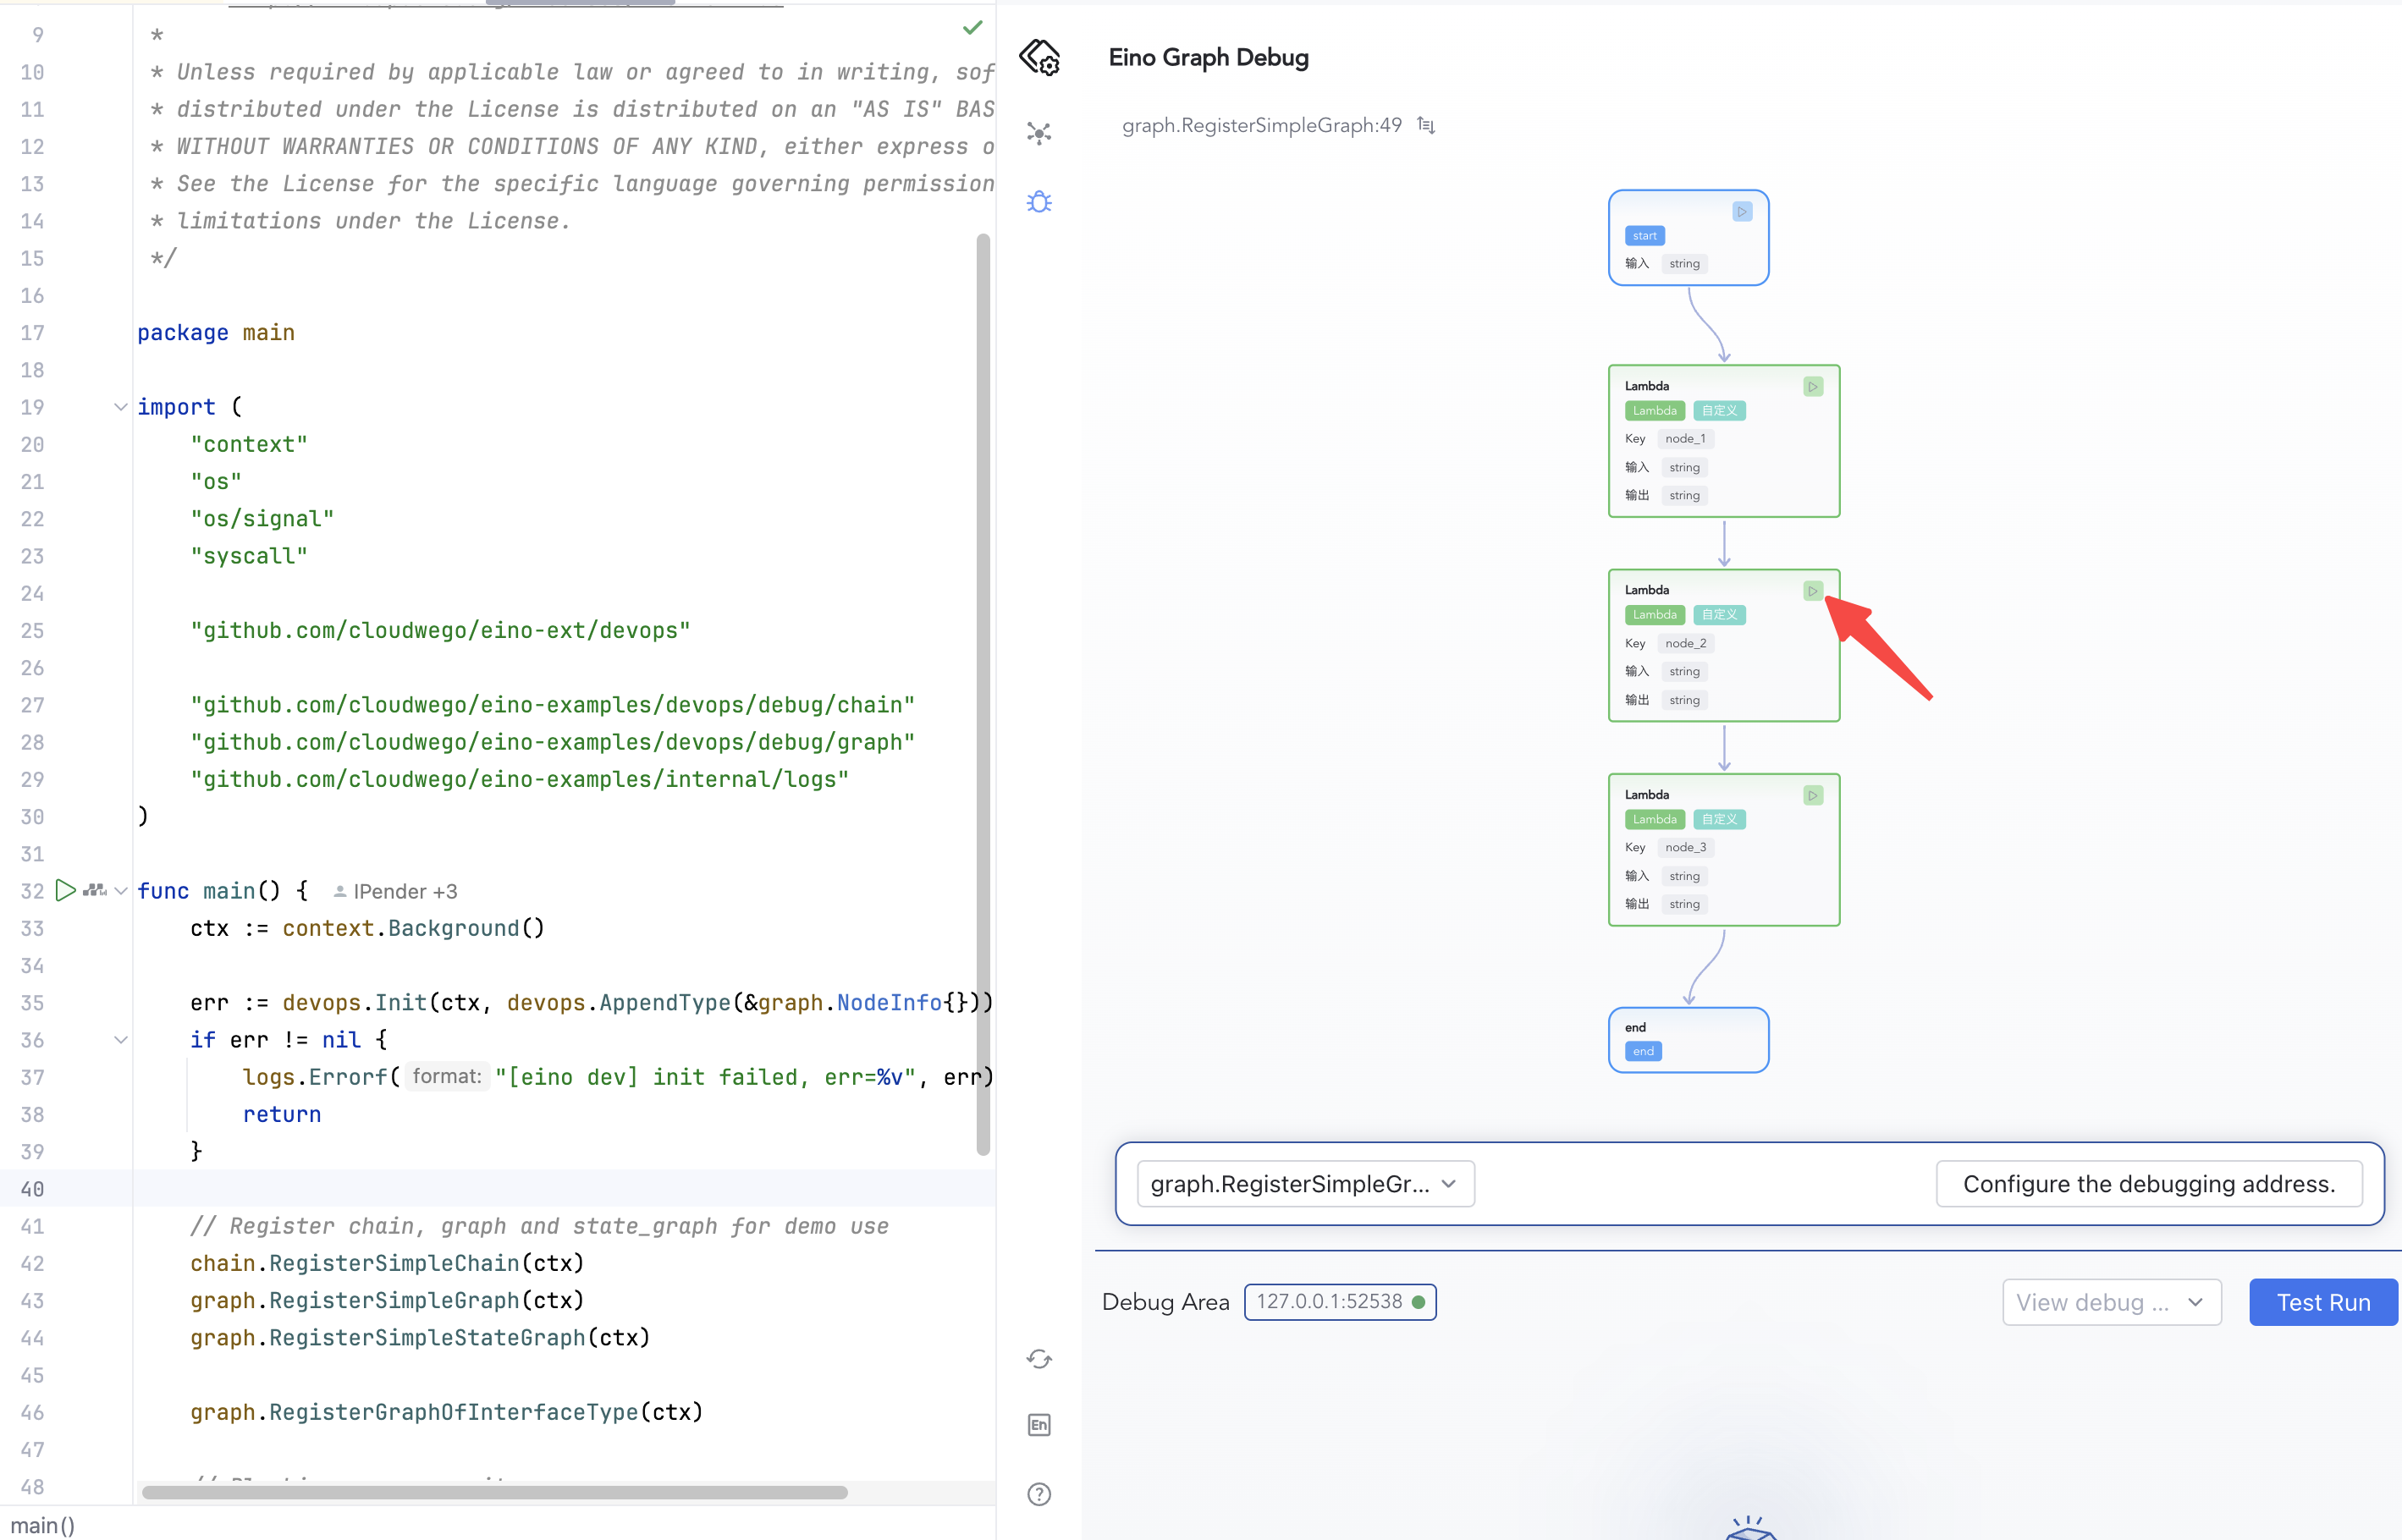
Select the Target Orchestration Artifact to Debug
Ensure your target orchestration artifact has been Compile()d at least once. Since debugging is oriented toward orchestration artifact instances, calling Compile() multiple times will register multiple artifacts in the debug service, and you will see multiple debuggable targets in the selection list.
Start Debugging
Debugging supports starting from any node, including the START node and other intermediate nodes.
- Starting from the START node: Click “Test Run”, then enter mock input (for complex input structures, the system will automatically infer the input structure), then click Confirm to start executing your graph. Each node’s result will be displayed below.
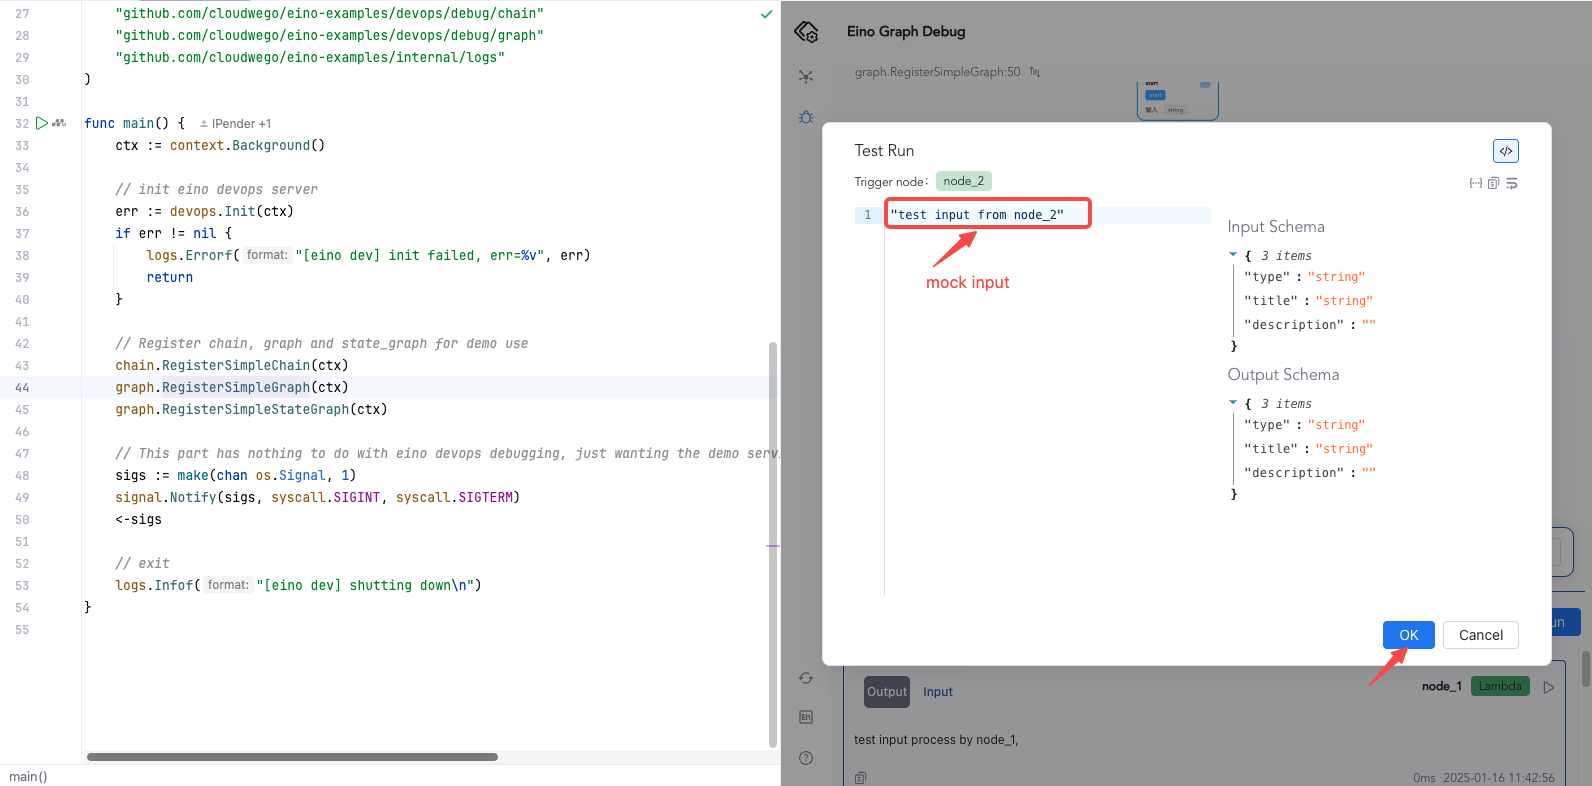
- Starting from any operable node: For example, start execution from the second node.
View Execution Results
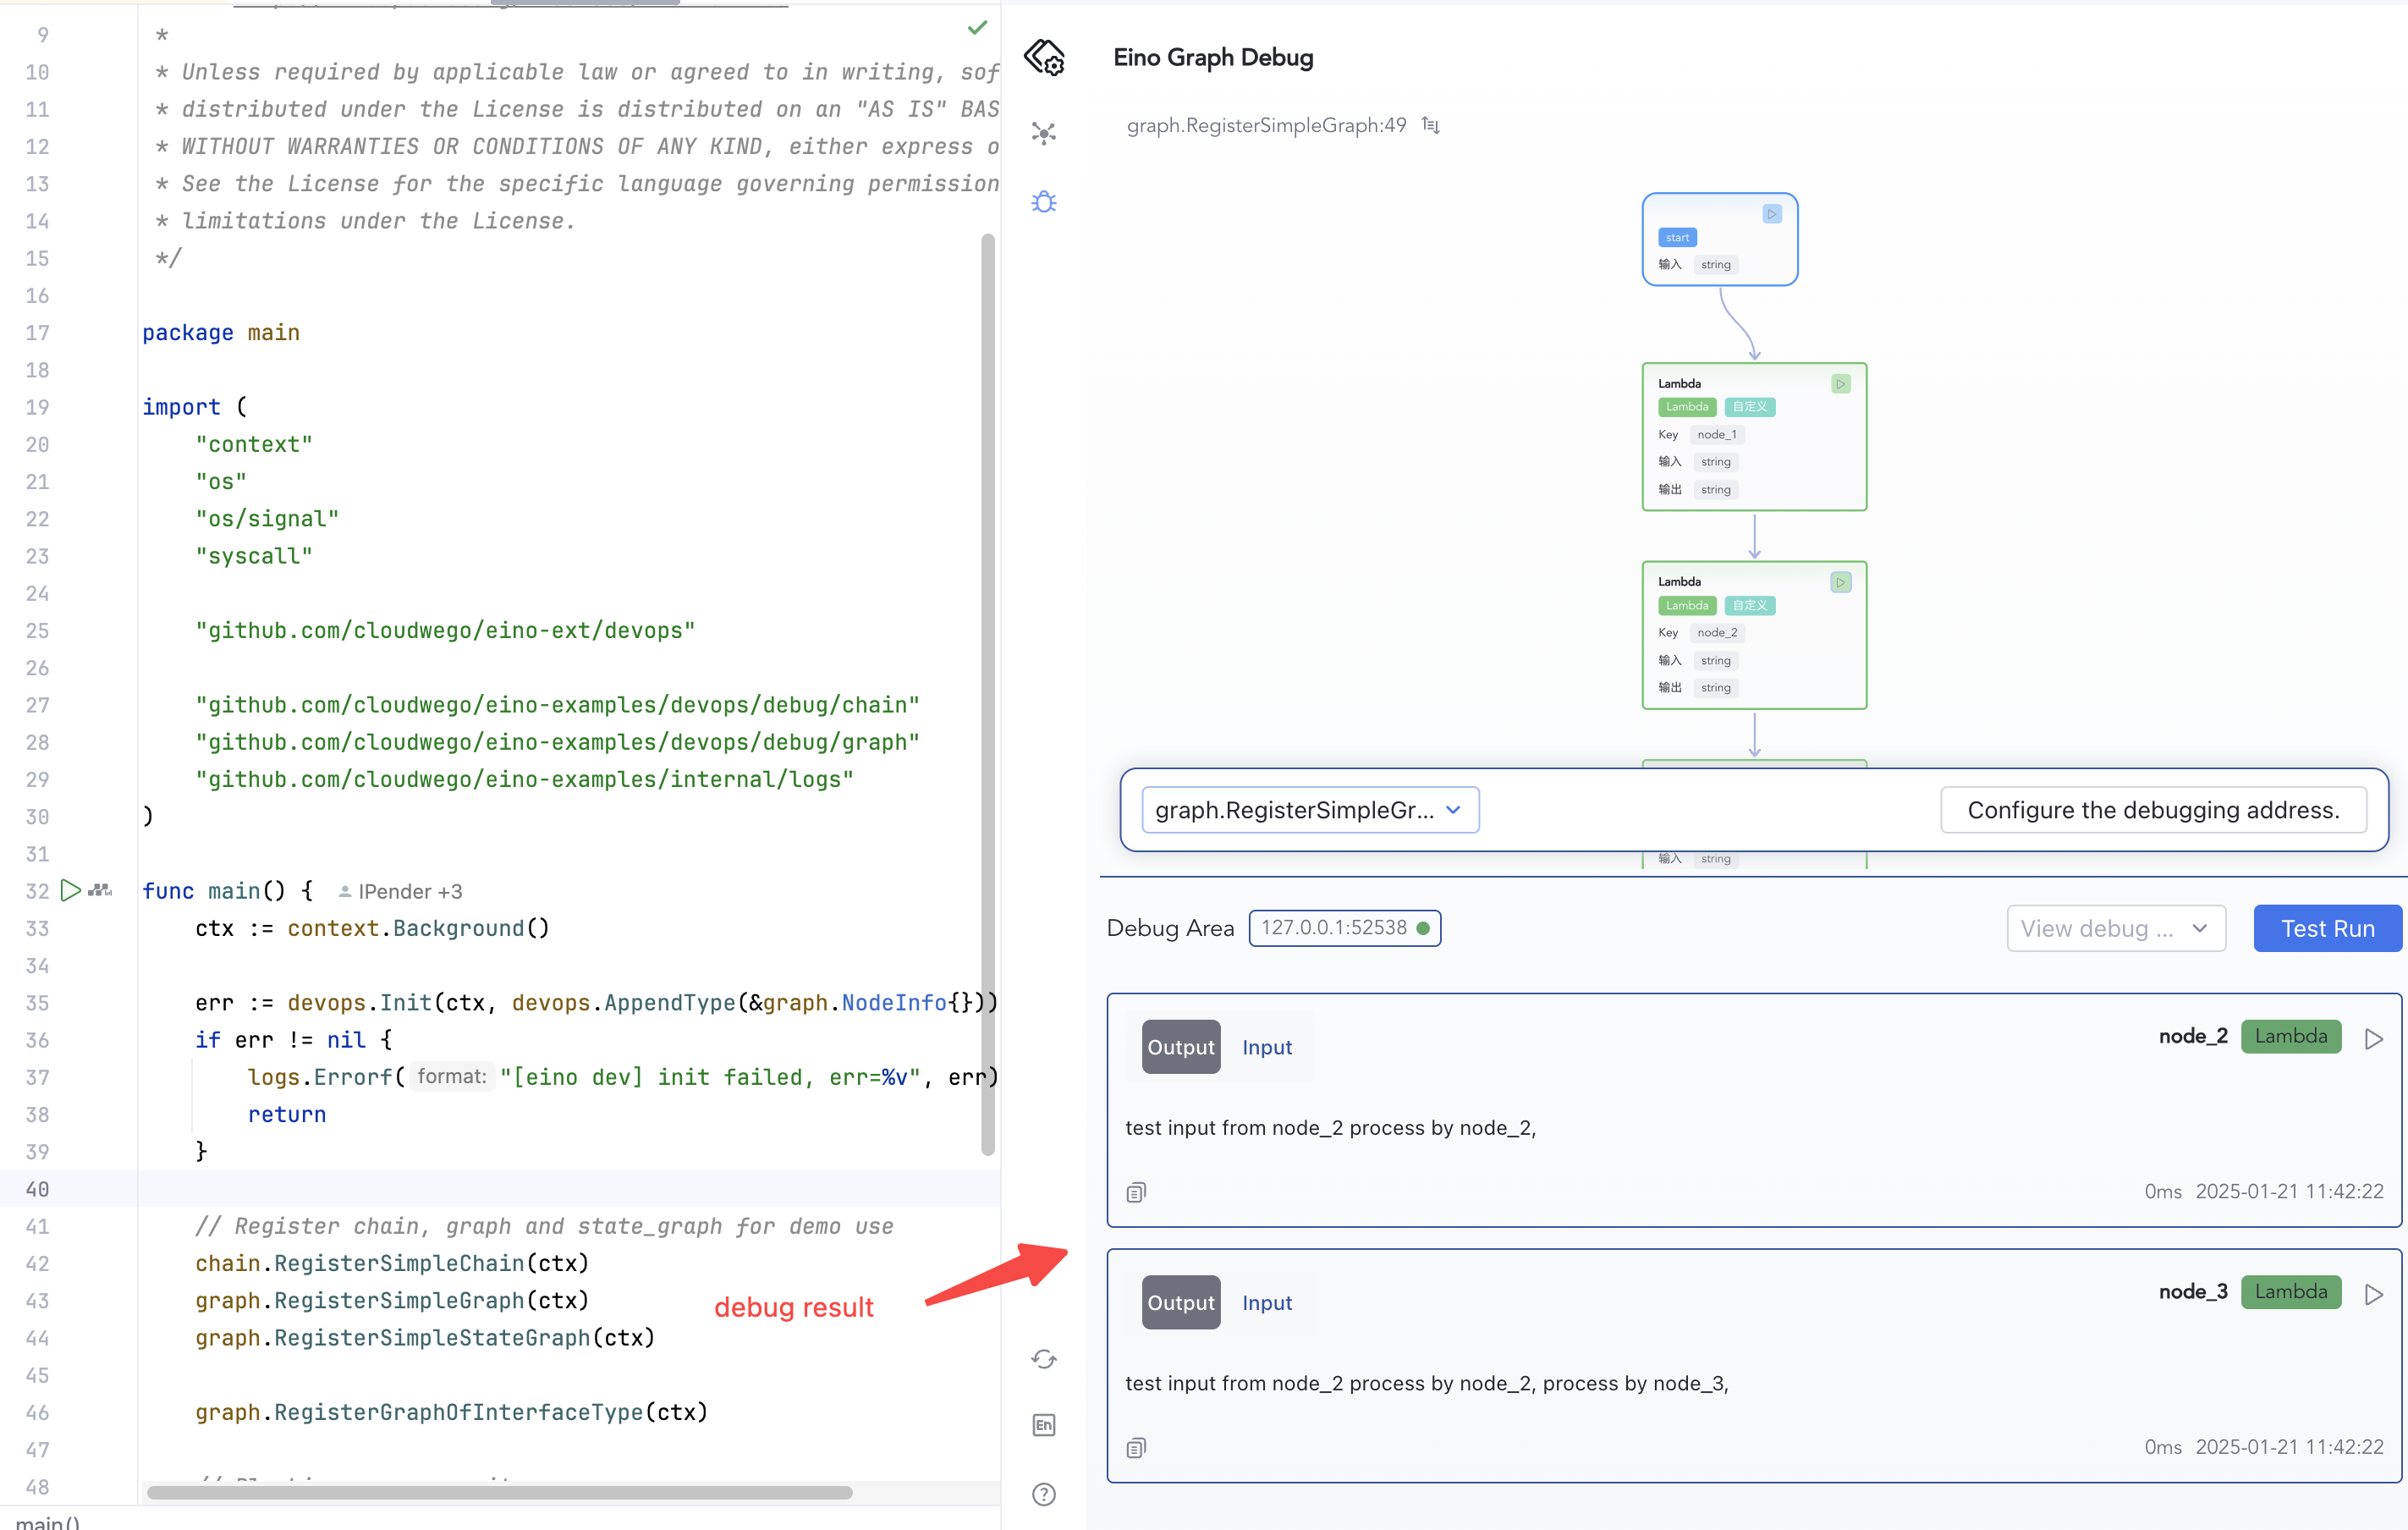
When debugging from the START node, click Test Run and view the debug results at the bottom of the plugin.
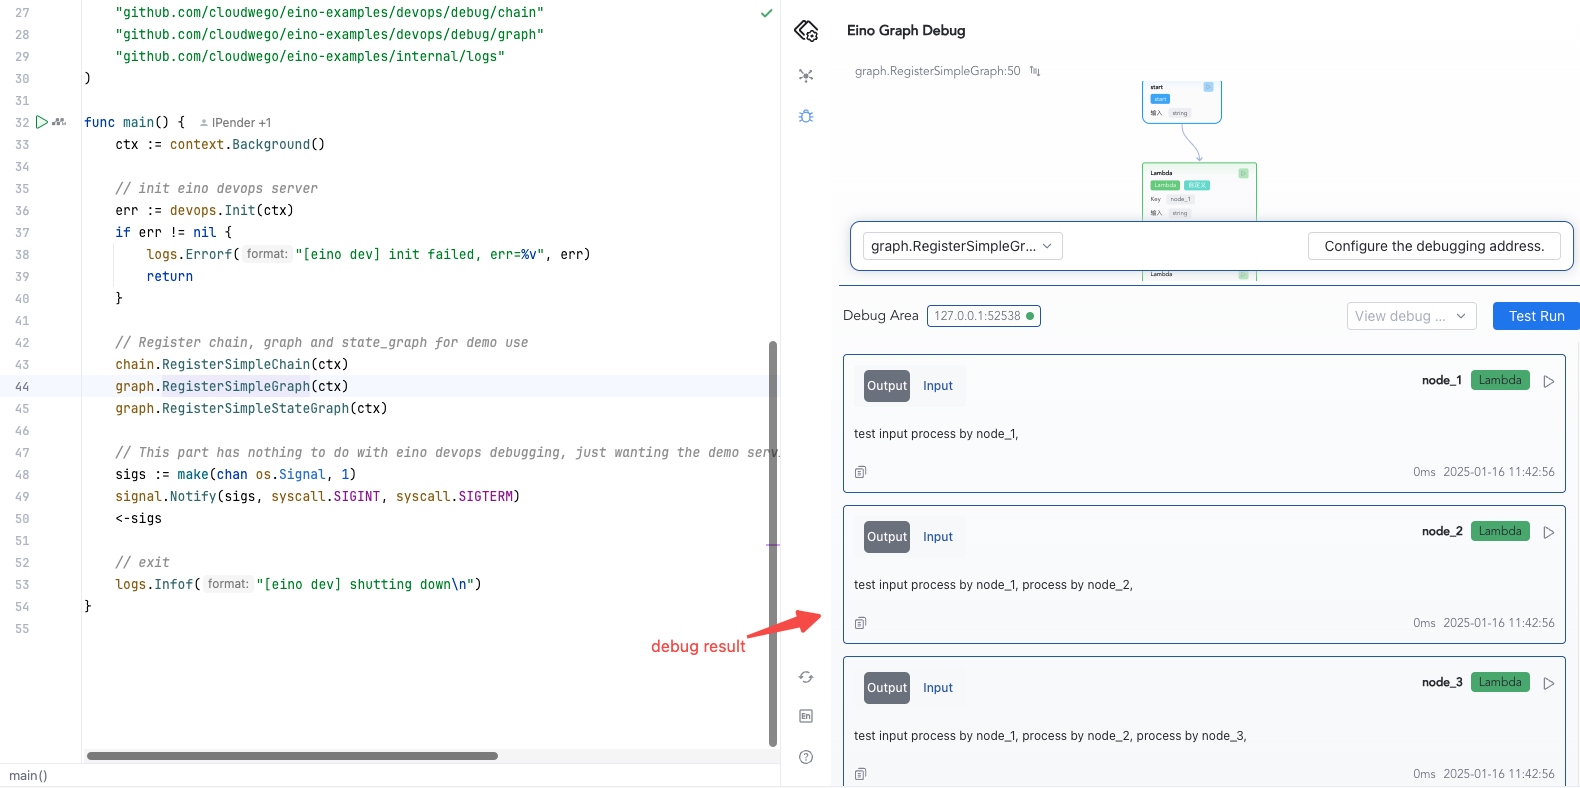
When debugging from any operable node, view the debug results at the bottom of the plugin.
Advanced Features
Specifying Implementation Types for Interface Fields
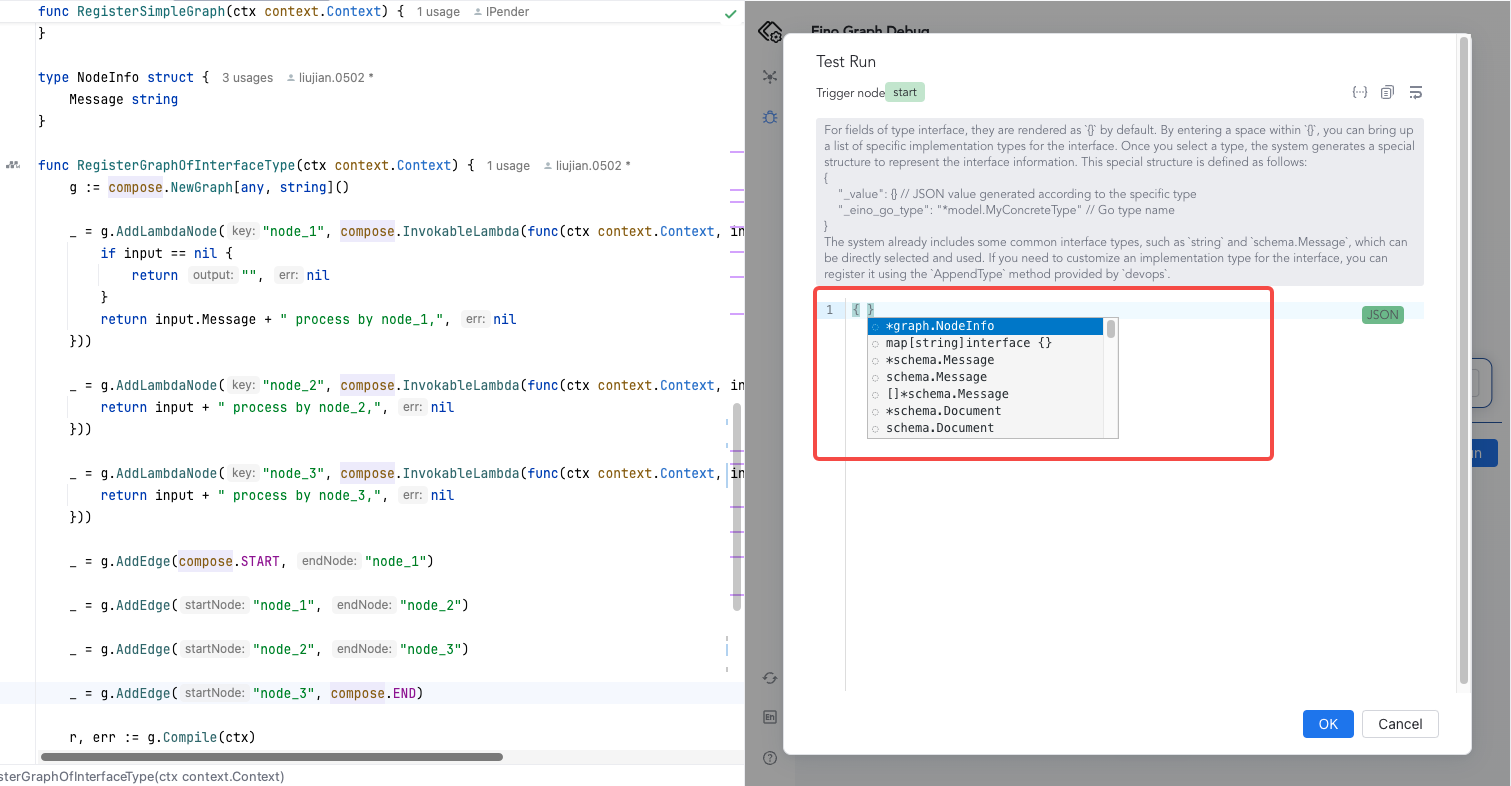
For interface-typed fields, they are rendered as {} by default. Typing a space inside {} will bring up a list of implementation types for the interface. After selecting a type, the system generates a special struct to express the interface information; the special struct is defined as follows:
{
    "_value": {} // JSON value generated based on the concrete type
    "_eino_go_type": "*model.MyConcreteType" // Go type name
}
💡 The system has built-in common interface types such as
string,schema.Message, etc., which can be selected directly. If you need custom interface implementation types, you can register them via theAppendTypemethod provided bydevops.
-
Suppose you already have orchestration code as follows, where the graph input is defined as
anyandnode_1’s input is defined as*NodeInfo:type NodeInfo struct { Message string } func RegisterGraphOfInterfaceType(ctx context.Context) { // Define a graph that input parameter is any. g := compose.NewGraph[any, string]() _ = g.AddLambdaNode("node_1", compose.InvokableLambda(func(ctx context.Context, input *NodeInfo) (output string, err error) { if input == nil { return "", nil } return input.Message + " process by node_1,", nil })) _ = g.AddLambdaNode("node_2", compose.InvokableLambda(func(ctx context.Context, input string) (output string, err error) { return input + " process by node_2,", nil })) _ = g.AddLambdaNode("node_3", compose.InvokableLambda(func(ctx context.Context, input string) (output string, err error) { return input + " process by node_3,", nil })) _ = g.AddEdge(compose._START_, "node_1") _ = g.AddEdge("node_1", "node_2") _ = g.AddEdge("node_2", "node_3") _ = g.AddEdge("node_3", compose._END_) r, err := g.Compile(ctx) if err != nil { logs.Errorf("compile graph failed, err=%v", err) return } } -
Before debugging, register the custom
*NodeInfotype via theAppendTypemethod duringInit():err := devops.Init(ctx, devops.AppendType(&graph.NodeInfo{})) -
During debugging, in the Test Run JSON input box, interface-typed fields will appear as
{}by default. You can type a space inside{}to view all built-in and custom-registered data types and select the concrete implementation type for that interface.
- Fill in the debug node input in the
_valuefield.
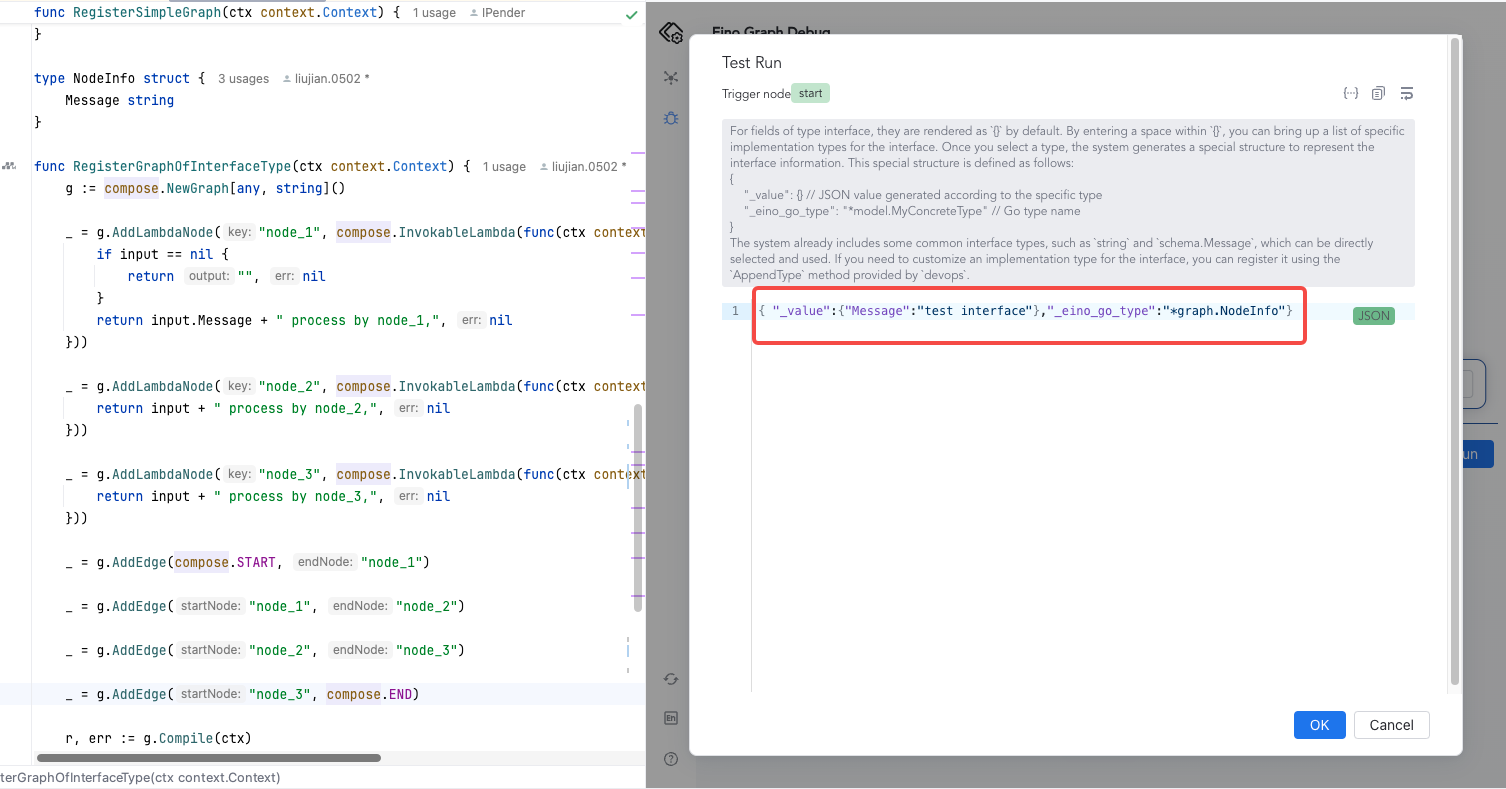
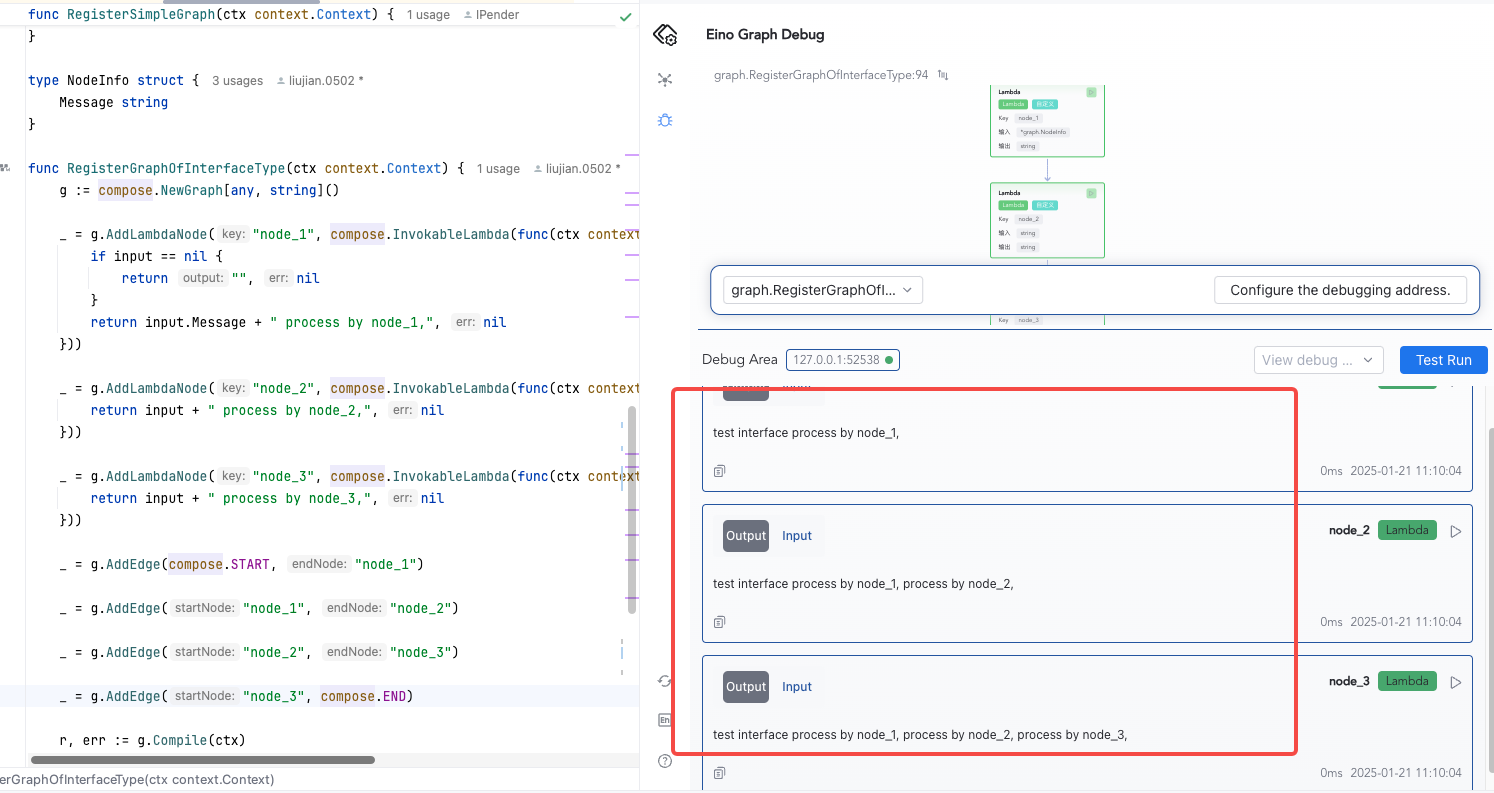
- Click Confirm to view the debug results.
Debugging map[string]any
Here is an additional explanation on how to debug when the input type is map[string]any. If a node’s input type is map[string]any, as shown below:
func RegisterAnyInputGraph(ctx context.Context) {
        g := compose.NewGraph[map[string]any, string]()

        _ = g.AddLambdaNode("node_1", compose.InvokableLambda(func(ctx context.Context, input map[string]any) (output string, err error) {
                for k, v := range input {
                        switch v.(type) {
                        case string:
                                output += k + ":" + v.(string) + ","
                        case int:
                                output += k + ":" + fmt.Sprintf("%d", v.(int))
                        default:
                                return "", fmt.Errorf("unsupported type: %T", v)
                        }
                }

                return output, nil
        }))

        _ = g.AddLambdaNode("node_2", compose.InvokableLambda(func(ctx context.Context, input string) (output string, err error) {
                return input + " process by node_2,", nil
        }))

        _ = g.AddEdge(compose.START, "node_1")

        _ = g.AddEdge("node_1", "node_2")

        _ = g.AddEdge("node_2", compose.END)

        r, err := g.Compile(ctx)
        if err != nil {
                logs.Errorf("compile graph failed, err=%v", err)
                return
        }

        message, err := r.Invoke(ctx, map[string]any{"name": "bob", "score": 100})
        if err != nil {
                logs.Errorf("invoke graph failed, err=%v", err)
                return
        }

        logs.Infof("eino any input graph output is: %v", message)
}
During debugging, in the Test Run JSON input box, you need to enter the following format:
{
    "name": {
       "_value": "alice",
       "_eino_go_type": "string"
    },
    "score": {
       "_value": "99",
       "_eino_go_type": "int"
    }
}